This alone warrants close attention on the horizon for harbingers of a cycle turn. But the industry has also seen the emergence of softness in financial and professional lines over the last 6-12 months, spanning public D&O, non-medical professional liability and cyber.
Fears that this softness will spread into the much larger general liability market later this year are being discussed in quiet voices by some sources.
Inside P&C spoke to sources across the general liability value chain, looking for the five traditional harbingers of a soft market.
Line size expansion
Growing admitted market risk appetite
Peaking E&S flows
Retail broking impatience with the heavy use of wholesalers
Client rate fatigue
There is uneven evidence that the five phenomena are starting to appear in the market. But to date this is based on isolated data points, anecdotes and cases at the margin.
There is enough noise, however, that suggests there are worrying elements here that have the potential in time to tip the market into softness.
These fears are supported by evidence that the cycle extenders could be weakening in some cases, and becoming less likely in others.
Reinsurance market dislocation has already lessened after 7 months. Economic inflation has fallen 5 percentage points to less than half its peak.
The (financial) disruption resulting from the Ukraine conflict has eased. Recession fears have also lessened, with equity markets pointing to a soft landing. And, of course, with interest rates hitting 5.25%, the old temptation of cashflow underwriting has returned.
As of Q2, however, the market seems quite finely poised following its period of radical change in 2019-21 when rates surged, limits compressed, attachment points rose, T&Cs tightened, and business surged into the wholesale channel.
Indeed, when it comes to rates there has been some re-acceleration from Q4 to Q1 and again into Q2 in the lead umbrella and first excess layers, particularly for Fortune 1000 clients and above. This came after the “head fake” of a clear Q4 tapering of rate rises.
Chubb, in particular – and AIG to a lesser degree – was cited as flinty, and a key factor in rates ticking up to +7.5% to +10%.
Higher up the tower there is more competition, with mid- and high excess layers up low to mid-single-digits, and reductions of low single-digits achievable in some cases.
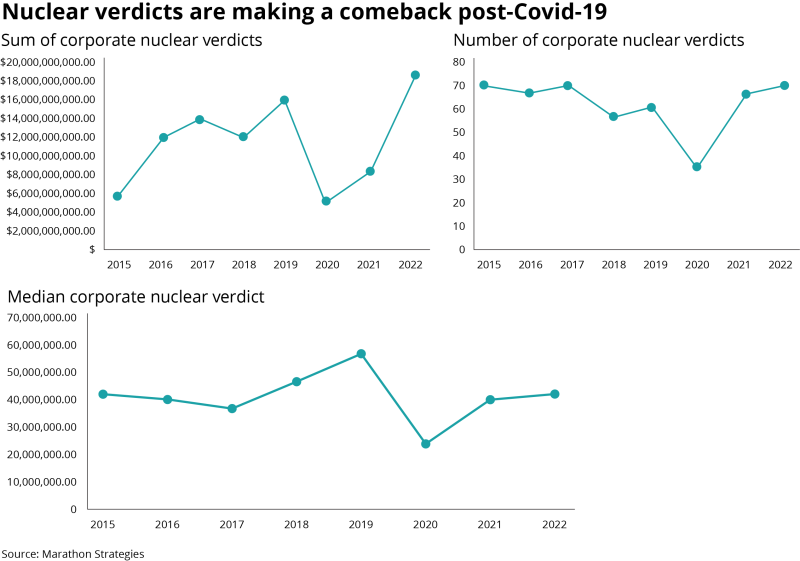
The extent to which the market feels poised reflects three key factors. First, severity is rising fast, with jury awards surging. One source said they had seen data that showed the average wrongful death claim rising from ~$10mn in 2019 to $18mn-$20mn in 2023 – equivalent to mid-to-high teens inflation.
Second, there are associated fears of material adverse development on the soft 2014-19 accident years.
Third, incidental commercial auto exposure in general liability programs is stiffening resolve right through the first $50mn of programs.
The more bullish in the industry maintain that the firming cycle in general liability is likely to be maintained in the medium term with flat to negative rates impossible to contemplate in a punishing loss-cost inflation environment.
Nevertheless, after 4-5 years of hardening rates, there is a nervousness that the cyclicality of the industry will reassert itself. And given the industry’s history of chasing growth, the base case has to be that a cycle reversal is on the way.
Prudent carriers will have their gaze fixed on the horizon for gathering harbingers of doom.
Here’s a quick summary of our key points below:
Limit expansion has started to emerge, with $2.5mn lines becoming $5mn, and $10mn lines becoming $15mn – but lead umbrella is relatively disciplined
Admitted market carriers are looking to grow, and want to repatriate some risks shed during remediation, with the first impact on E&S flows evident
Retail brokers are impatient of the heavy use of wholesalers, and clients are highly fatigued by compound rate rises
But loss cost inflation resulting from outsized jury awards is propping up discipline, along with fear of adverse development on old years, and incidental auto exposures
Rates in lead umbrella and the first excess have ticked up a little to 7.5%-10%, but middle to high excess business is more competitive
Background
Casualty insurance rate momentum has been moderating since last year, after a period of rapid market hardening between 2019-2021 when average line sizes in excess casualty were slashed, and rates broadly doubled.
According to sources canvassed by this publication, those rate increases in the lead umbrella space have come down to the range of approximately 7.5%-10%. For higher excess layers, rates are largely flat or increasing low single digits year-on-year.
While the pace of rate hardening has slowed down from its peak, it still remains in positive terrain, prolonging an unprecedented period of rate gains for the US P&C industry stretching back to 2018/19 that this publication has called the Long Firming.
This momentum drove huge business flows in E&S and helped create a Golden Age for specialty insurers that have been riding high.
It has long since become challenging to tell a single story about the US P&C pricing cycle, with the market increasingly fragmenting into micro-cycles. That has been in recent dramatic evidence, with sources pointing to 25%-30% reductions in public D&O, even as cat-exposed property accounts rise 30%-100%.
SECTION 1: The five harbingers
1. Limit expansion
The most closely watched harbinger of a cycle turn is limit expansion. The compression of $25mn limits into $2.5mn, $5mn and $10mn stretches in 2019 forced brokers to find more markets to finish placements, drove business into the E&S market, and gave carriers pricing power.
Limit expansion crunches the number of insurers needed to finish a placement, and spurs price competition as carriers look to defend their participation by cutting rates.
The source intelligence on limit expansion was incredibly uneven. There was unanimity that there are no $25mn lead umbrella limits on offer in the market, and that we aren’t close to that. Indeed, some believe it will never return.
Otherwise, there was a host of conflicting intel. Insurers tended not to admit to putting out bigger limits themselves, but a number acknowledged they had seen examples where $2.5mn lines had become $5mn at competitors, or $10mn lines had become $15mn. It is also still possible to find $25mn in the high excess layers.
Overall, line size expansion is cancer for a hardening cycle
Reinsurance broking sources said they had not seen this show up in their data yet, but suggested they were seeing elements of limit expansion across the tower, with some $15mn lead umbrella lines being deployed.
Importantly, available capacity in general liability for any one risk dropped from $750mn+ to closer to $500mn due to the limit compression. As such, the doubling of a line will not always swallow the layer of the carrier above – in some cases the limit will just be shifted upwards to give the insured more vertical protection. This dampening effect will not apply with smaller clients buying $100mn or $200mn of protection.
Overall, line size expansion is cancer for a hardening cycle. But again, short term, there is an effect where it can hold up rates because a $5mn xs $50mn that becomes a $10mn xs $50mn tends to cost more than the combined effect of the two stretches (owing to discounts offered versus the layer below).
2. Admitted market appetite
The total US commercial lines market is $439bn of premiums, while the E&S market is ~$100bn based on projecting out AM Best’s latest figures. This suggests the admitted market is more than 3x its size.
As such, the admitted market drives the bus, first in dropping business that the E&S market can pick up and then at the end of the hardening phase in reclaiming it.
Sources again described a mixed picture on admitted market risk appetite. They noted that standard lines management teams in a number of cases were pushing their teams to grow – but that for the most part that growth is being pursued cautiously. One underwriting source suggested the admitted carriers are becoming “enamored of pricing”.
Mid-market and small commercial business – the Travelers/Hartford clientele – was picked out as an area where admitted carriers have become more competitive, particularly for clients with a vanilla risk profile and a better loss record.
Segments like manufacturing and construction were cited as areas where admitted carriers had become more expansive.
Equally, there was still extremely limited appetite for public entity, habitational or wildfire-exposed risks, sources said.
3. Peaking E&S flows
Again, the data is uneven on submission flow for E&S carriers. Some specialty insurance sources suggested they continued to see robust increases in submissions, including in casualty. E&S flag bearer Kinsale said in its Q1 call that it was still seeing submission growth “in the low 20% range”.
Some sources described flows in casualty as stalled, but at historically high levels. Another suggested they had seen mid-to-high single digit growth in the quarter. One wholesale broker suggested that submissions had peaked, with overall volumes in E&S supported by the hard property market. (D&O and professional liability are also showing major outflows, with one E&S underwriting source suggesting D&O submissions are back to 2019 levels.)
The available public data provides some support for the idea that the item count in E&S casualty may be past the peak.
A basket of stamping office data comprising California, Florida, Texas and New York shows the item count for the year-to-date is down 0.2% year-on-year, with premiums up 10.9%. This flat figure was recorded despite sizeable property in-flows.
Importantly the aggregate position masks state-wide variation, with Texas and Florida driving the peaking, and the trend not evident for California or New York.
WSIA data does, however, suggest that the major increases in E&S premiums owe much more to rate than volumes, with growth in item count in 2021 and 2022 in only the 6-7% range.
4. Retail broking impatience with the heavy use of wholesalers
Another harbinger of a cycle turn is when retail brokers reach a fever pitch of frustration with using wholesale brokers to place business.
The hardening cycle has been a bonanza for wholesalers, with Amwins and Ryan Specialty consistently putting up ~20% organic growth during 2019-22 as retailers struggling to secure capacity turned to them to maximize placement options.
You will hear nothing publicly besides bland praise for their valued wholesale broking partners, but privately there is frustration. Wholesale broking has grown much more rapidly than retail, and the Big Three have been locked out, with a lot of the other top-20 US brokers having only small positions in wholesale.
In part the desire to “bring the business home” reflects the wholesale brokerage that retailers have to give up. But perhaps as importantly, repatriating the business gives retail brokers more levers they can pull when the market softens.
It opens up scope to earn contingents, or other forms of market-derived income around facilitization/strategic carrier relationships, that represent a means of delivering growth in a falling market.
To date, relatively little has been achieved on this front, but it is on the minds of senior broking executives as they nervously eye the ultimate end of the brokerage super-cycle.
5. Client rate fatigue
Rate rises ultimately depend on clients’ willingness to transact with insurers at (or above) the risk carrier’s walkaway price.
After years of compound rate rises, client fatigue was one of the key themes from risk managers at April’s RIMS conference.
Clients were frustrated in particular at rate rises at a time when the better commercial lines-focused carriers are reporting combined ratios in the 80s and significant increases in investment income.
A shortage of property cat capacity was the key point of controversy, but it was not the only area of frustration.
Captive formation and usage is believed to have been on the rise for some time, with some share lost by commercial insurers.
But the key conduit for client unhappiness is the retail brokers, with intermediaries more likely to go to war for insureds that are crying for relief.
SECTION 2: The factors keeping the market in balance
Despite early evidence of the harbingers of a turn, general liability rate rises are holding up and reductions are rarely being achieved by brokers, even for clean accounts.
Unlike the higher excess layers where rate increases remain broadly stable from Q1, some sources suggest that rates in the lead umbrella and first excess space have picked up a little pace recently. One of them said some carriers have quoted 15% rises in mid-year renewals, although that was rarely achieved.
Behind that push is a sense of caution surrounding the severity of claims that are now coming through following the pandemic’s flattering influence primarily on 2020 and 2021.
“[US] courts have fully opened again, the large verdicts are continuing to come in - perhaps at a little bit of a quicker pace,” one broker said.
Discussion around loss-cost inflation tends to be around the 5%-7% range, but there are sources who believe that it could stretch into the low double-digits.
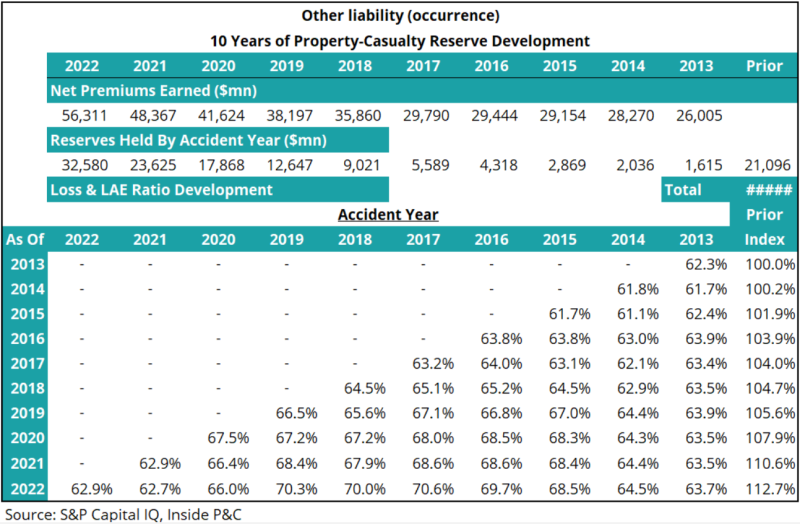
The industry is also waiting to see the extent of adverse reserve development for underwriting years 2014 through 2019. Right now, sources said they are watching closely as the claims picture on the 2018 and 2019 underwriting years becomes clearer.
Reinsurers were particularly bearish around the outlook saying that they were seeing deterioration on back books through Q1 and into Q2.
“Prior-year reserve development is what drives prices. So the most relevant question is how weak are prior-year reserves,” one reinsurer executive said when asked how the market would develop.
The insurance industry did not hold its loss pick in other liability occurrence between 2013 and 2019, and multiple years have deteriorated by more than 5 percentage points.
In addition, the first umbrella layer continues to be dominated by a handful of carriers like Chubb, AIG, and Zurich that remain disciplined about expanding exposure in accounts with lower attachment points.
Chubb in particular has taken a markedly tougher line through 2023, according to multiple sources, and has likely buoyed the market more broadly.
New market entrants to excess casualty are simply not big enough – or credible enough - to compete in that first $25mn of the tower, even if they were willing to drop down that low.
Commercial auto is also playing a role in buttressing rates in general liability for non-transportation firms.
After many years of losses, with a brief pandemic-induced upturn, commercial auto rates have again fallen behind loss costs with jury awards out of control.
This is causing huge dislocation for transportation firms, but also has an effect for the commercial auto exposures in other industries.
One specialty underwriting source said that their biggest general liability claims were related to auto bodily injury claims for non-transportation firms with a small number of vehicles.
“Almost every business has some form of auto exposure,” one insurer executive said, whether it’s in the form of employees driving in company cars or construction workers in pick-up trucks.
SECTION 3: Two paths forward
In messaging that is likely to be rehearsed repeatedly on second quarter earnings calls in a few weeks, insurers stressed that rate-taking remains necessary because “social inflation” is impacting loss costs.
Privately some also referenced fears that adverse development would need to be recognized on old underwriting years.
Often reduced to the epithet “social inflation”, the drivers of higher-than-average loss cost inflation include an anti-corporate sentiment, mistrust of elites, growing inequality, and the industrialization of claims including via the use of litigation financing.
These look like long-term phenomena and absent tort reform (which is extremely unlikely) seem likely to continue to drive substantial increases in severity.
The more bullish in the industry believe that it will be hard for there to be a repeat of the late 80s, mid 90s, or mid-2000s cycle reversals because loss cost inflation was more benign in all of these cases – allowing insurers to chase market share with greater confidence.
This group argue that the current period of balance in which rates are believed to be broadly tracking loss cost inflation (below the high excess layers) could perpetuate itself. In this scenario, general liability would just be the latest line to exhibit a micro-cycle if the broader commercial lines market goes soft in 2024 or 2025, say.
At some point, insurers typically start to chase growth and those on the offence start to cut rates
Telling the future is hard, and the current cycle has already unfolded in an unprecedented way given the length of firming, and primary pricing moving before reinsurance.
Nevertheless, rate rises running at 5%-10% indefinitely seems an unlikely scenario given the industry’s history. At some point, insurers typically start to chase growth and those on the offensive (followed by those playing defence) start to cut rates.
At least for a time, more growth-focused insurers can square circle on loss costs by a combination of a more optimistic view than their peers on trend, and the sharp increase in new money yields.
As much as the industry tries to stress that it prices risk purely to deliver underwriting profit, the majority of pricing models have projected investment returns as an input. With new money yields of 4-4.5%, and investment leverage in the 2.5x-3x range for many carriers, it is easy enough to see the path to a double-digit ROE for a long-tail book without any contribution from underwriting.
This is a dangerous game because investors will not value these earnings as highly, and because when you start writing to a 100% combined ratio, it has a habit of becoming 105% then 110%.
Still, the temptation to move in this direction is real, and some players will do it – whether that is in Q3, Q4, or off into 2024 or (less likely) 2025.
As it stands, the general liability market is finely poised but it will not remain so forever. For now, it will pay to keep a close eye on the gathering harbingers of the turn.