
However, results show we aren’t quite there yet, and getting across the finish line will depend on the industry’s ability to maintain discipline and stay ahead of the loss cost curve.
Our note examines this trend in more detail.
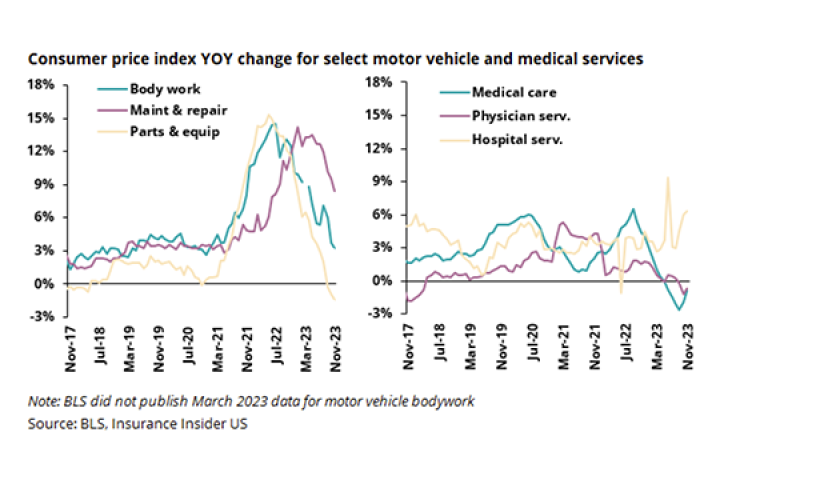
Auto loss cost severity factors in the CPI generally shows continued improvement, but medical is still a wildcard
In our recent note on November rate filings, we expressed a need for caution, and keeping an eye on the future trajectory of auto loss cost inflation.
The chart below shows how those lost cost-related metrics have shifted this month.
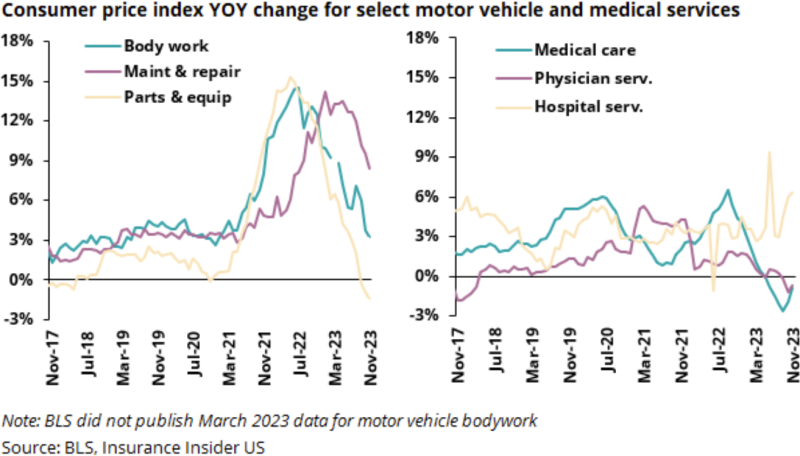
There are a few things to highlight here.
Bodywork and maintenance and repair are still reaching all-time highs, but are markedly decelerating, with bodywork’s growth now in the low single digits. Maintenance and repair is still increasing at 9% which is very high, but it has come down from recent mid-double-digit highs. Parts and equipment, which crossed zero recently (meaning the index has peaked) continued even lower this month, meaning the index is shrinking.
On the medical side, physician services and medical care are still decreasing, but less than last month. On the other hand, hospital costs are growing at an accelerating rate. While all three remain low, we would suggest this is an area to watch as the trend is unclear due to the amount of volatility.
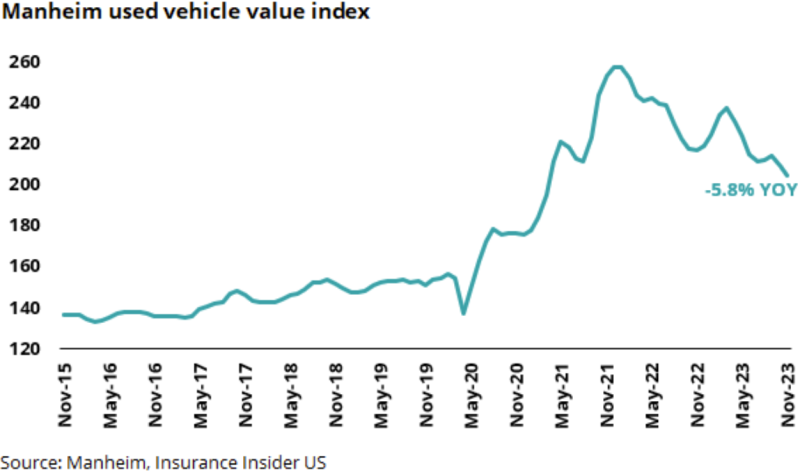
Outside of the CPI, the Manheim used vehicle index is also showing a continued decline.
Combining these trends, we have two takeaways. The first is that loss cost factors related to severity are definitely moderating, with this trend clearer than in prior months. The second is that we may see a divergence between physical damage and liability severity trends, as the repair-related costs moderate while medical remains volatile.
On the other hand, the medical costs index has remained somewhat rangebound, and if it continues, this is a chance for carriers to play catch up. We would note that frequency is a whole different matter, and caution is always required on that front.
The balance between premium inflation and loss cost inflation continues to trend in the right direction
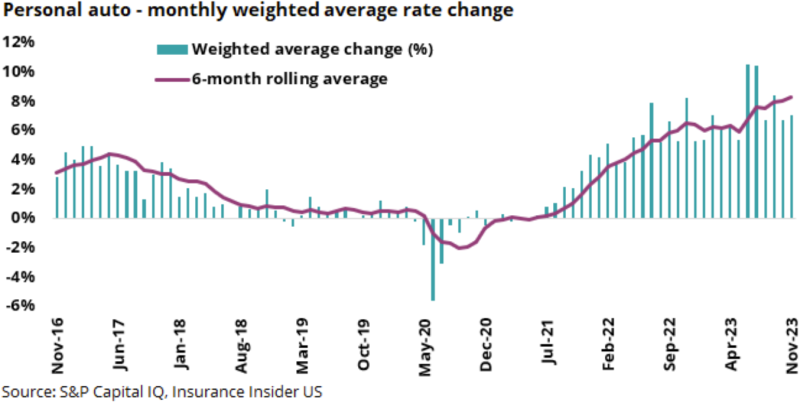
We’ve discussed the rate filing drop off in our last CPI and rate filings notes. The chart below shows this trend, with the last four months or so dropping off as far as the industry’s weighted average rate change.
This is a bit concerning, because, at a simplistic level, we would like to be past the peak in loss cost growth before we see the rate filings drop off.
However, we can look at this from another viewpoint as well. The chart below shows the CPI’s auto premium inflation index, compared to a composite of the inflation factors we track.
The industry benefits during the blue shaded areas, and is hurt by the gray areas. We can see that the blue area is expanding at an increasing rate.
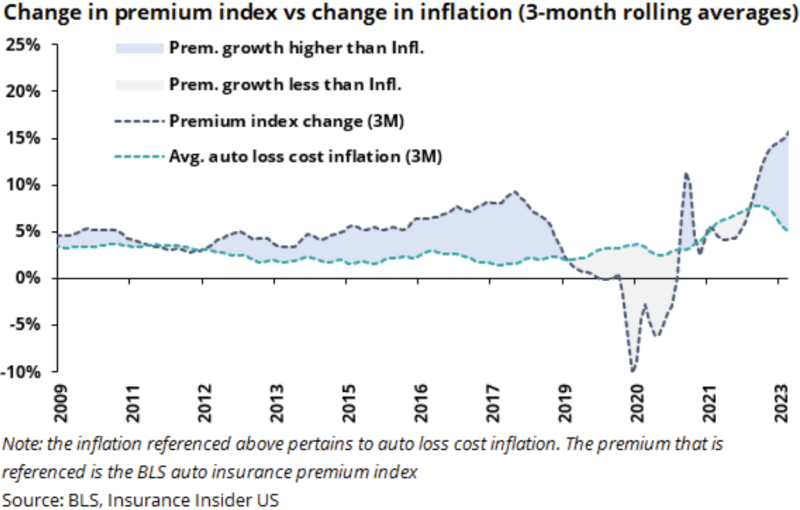
This means that the difference is trending in the direction that is positive for the industry. However, going back to our original point, the gray area will only be undone when the blue area is of equal size (since the lines are rates of change), and it does not look like we are quite there yet.
So, while things are definitely headed in the right direction, a second look suggests it is still too early to declare victory.
Loss ratio trends improve directionally, but many are still outside the optimum range
We can speculate about the direction of the race between loss costs and inflation, but at the end of the day, rate filings and CPI are still just proxies and have a number of caveats. The actual measure of results can only be confirmed after the fact, in the results.
Looking at the last quarter, we can get a sense of how the reality is playing out as compared to the proxies. The chart below shows premium vs. loss ratio for the industry in Q3 over the past several years.
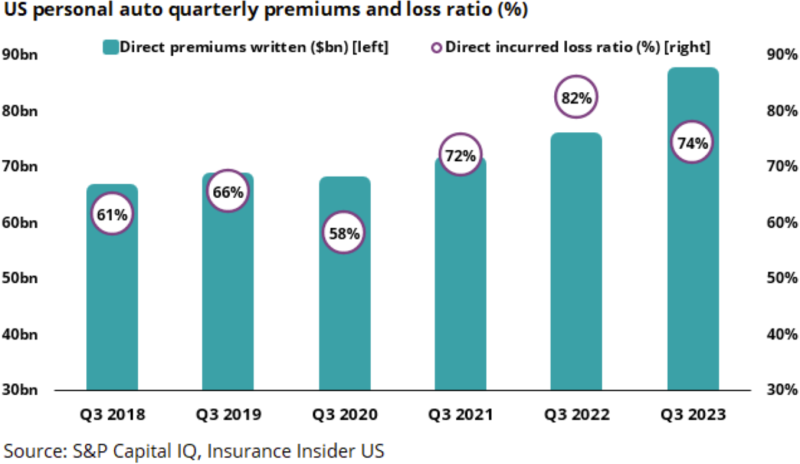
Overall, looking at these points, we do see a significant step down in the loss ratio. However, it is still elevated relative to the datapoints for 2018 and 2019, suggesting we are not all the way there yet. This supports the trend we were seeing in the data: ‘great work, but we aren’t there yet.’
Of course, this is at the industry level, so we are seeing a mishmash of results that could differ meaningfully, as some carriers are ahead of the curve on these shifts. The chart below shows the loss ratios for the top 10 names in the space.
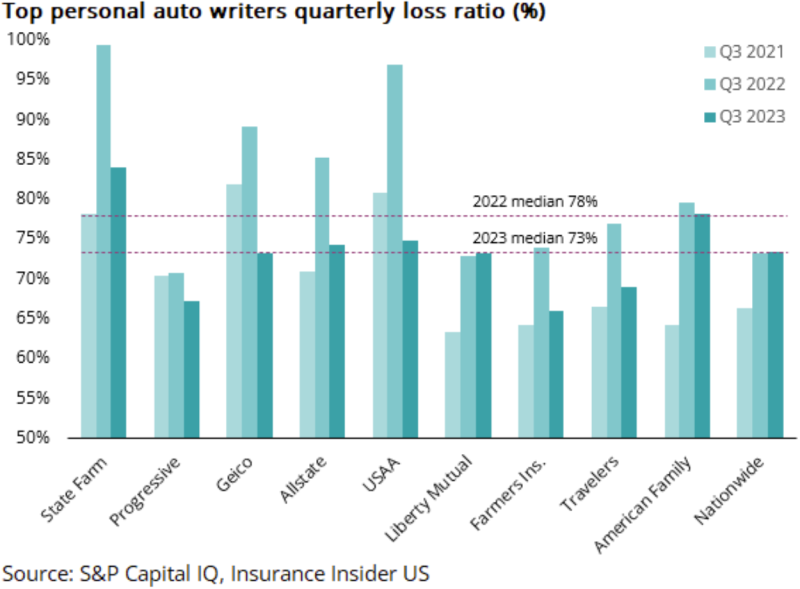
With State Farm being the biggest and also having some of the highest loss ratios, the company’s results are going to skew the industry number unfavorably. USAA is also contributing to this. Looking at the smaller companies, we see slightly more optimistic results.
Ignoring the outliers, we do see 2023 coming into a better range in the chart, but with most sitting slightly outside of the sweet spot.
This again points us to the same conclusion. Things are getting better, progress is being made, but we are not yet at the finish line.
In summary, looking at these severity-related metrics and the actual results from Q3 stat data, we see a fairly clear picture. Everything is trending in the right direction for the industry, with inflation moderating and premium increasing, leading to significantly improved results.
However, none of these measures yet indicates a return to stability. The direction we go from here will hinge on the industry’s ability to maintain its discipline, despite improving conditions that might lead to complacency.