With the recent stat data release, we have focused on the latest industry trends. However, this new data gives us additional insights into some of the struggling marketplaces we have been focusing on over the past year.
With the numbers out, we thought it would be a good time to revisit Florida, and see how trends shaped up through year end, since we had low hurricane activity one year after the devastation of Ian in 2022.
Given the stark difference between the last two years, we would expect a marked change in results, but our analysis has shown us that it depends on where you look.
This note will cover the most recent trends in premium shifts, results, and surplus for the Florida cohort.
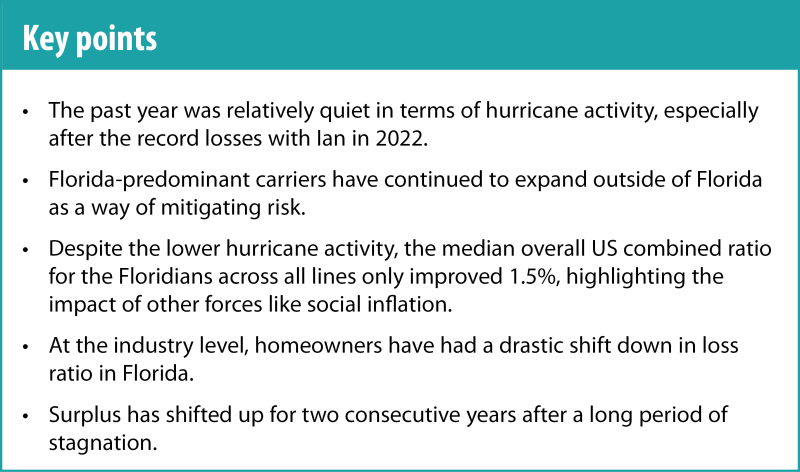
Floridians continue to diversify their books by expanding outside of Florida
We’ve spoken in our previous Florida pieces about how the market has structurally changed since Hurricane Andrew. Florida-predominant carriers quickly grew to fill the void left by exiting nationals, and we have seen multiple cycles of a cohort of players come in and then exit. The last cohort picked up growth a decade or so ago. However, this occurred around the same time as the uptick in hurricane activity and social inflation, which led to poor results for the cohort.
The assignment of benefits (AOB) issue is a notable social inflation issue that has been harming this group of carriers for several years now, and we have shown in previous pieces how this has developed over time.
One of the strategies we have highlighted for the Florida-predominant carriers is diversification with out-of-state risk. The chart below shows the relevant data. Specifically, it shows select companies' Florida premiums as a percent of their total direct written premiums in the U.S., with the rightmost column showcasing the diversification-driven shift from 2017-2023.
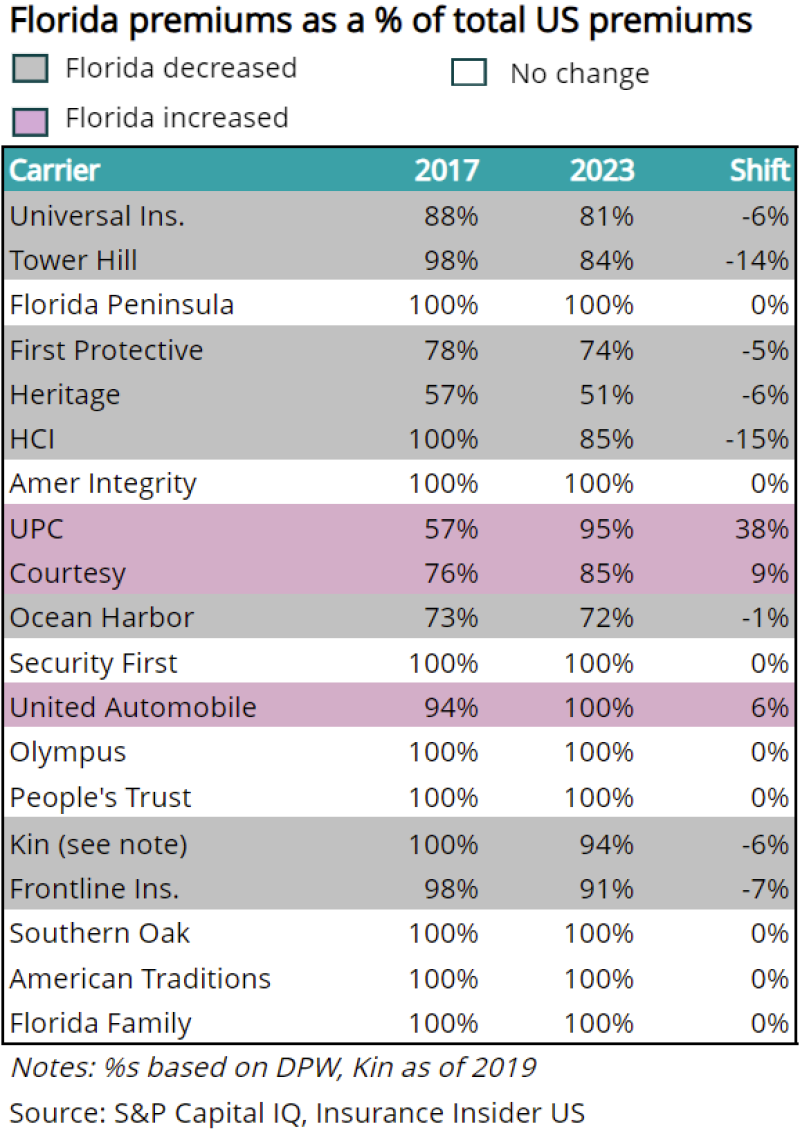
While there is not a clear link between this strategy and success or failure in the space, we do expect to see carriers that have survived so far to continue diversifying in the coming year.
Combined ratios for the group show marginal improvement, which is less than might be expected in the absence of an active hurricane season last year
The chart below shows the overall (i.e., total US) premium and combined ratio for Florida-dominant carriers, as well as the median (ex-Citizens). The premium (DPW) growth shows that the carriers are growing quite quickly, though it is interesting to note that the publicly traded cohort (ex-UPC) stuck to single digits compared to the overall 21% of the larger group.
The cohort’s combined ratio increased post Harvey-Irma-Maria (“H-I-M”) in 2017. It then peaked in 2020 despite continued storm activity and had an additional 1.5pt improvement in the median over the last year in the absence of storm activity.
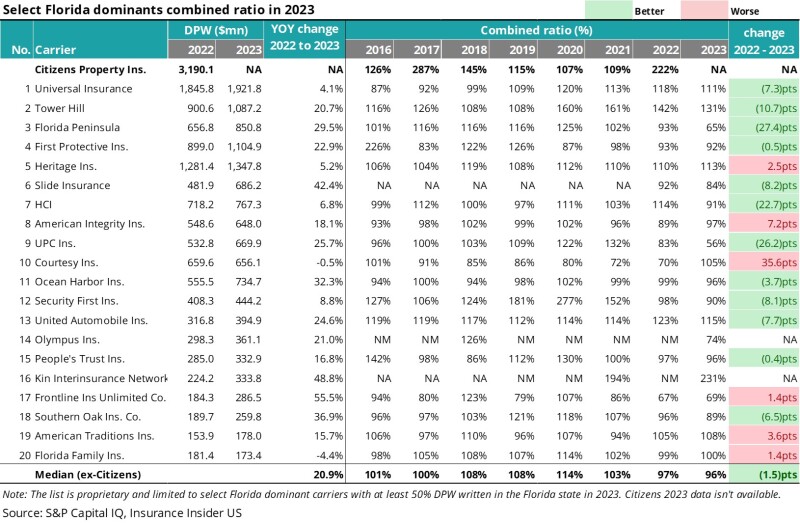
Though the overall trend for this sector is positive, the carrier-by-carrier analysis shows a slightly different picture, with a stark difference between performances.
Two key takeaways here are the numbers themselves, and the directional change. Seven of the 20 have combined ratios over 100%, including three of the top five carriers on the list. However, looking at these directionally using the last column, we do see that though nearly half are struggling, almost all show improvement, or at least, minimal worsening.
The interesting point here is that shifting from Ian in 2022 to a low loss year, we might expect to see a more significant shift for the group at large. This serves as a reminder that hurricanes are not the only issue for the market, and that social inflation has been eating away at underwriting results.
Florida homeowners results for the industry show a more drastic turnaround
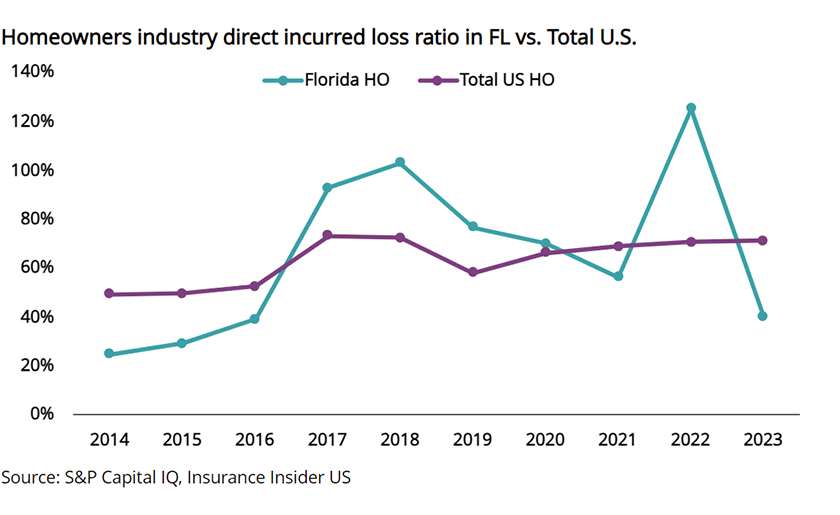
Above we showed the overall combined ratio for the Florida cohort in all states. The chart below gives us a different view that adds additional color to the situation. It shows the entire industry’s loss ratio in Florida compared to the overall US.
It also displays drastic shifts in the state that are not reflected at a higher level, with the loss ratio dropping from 125% in 2022 to 40% in 2023.
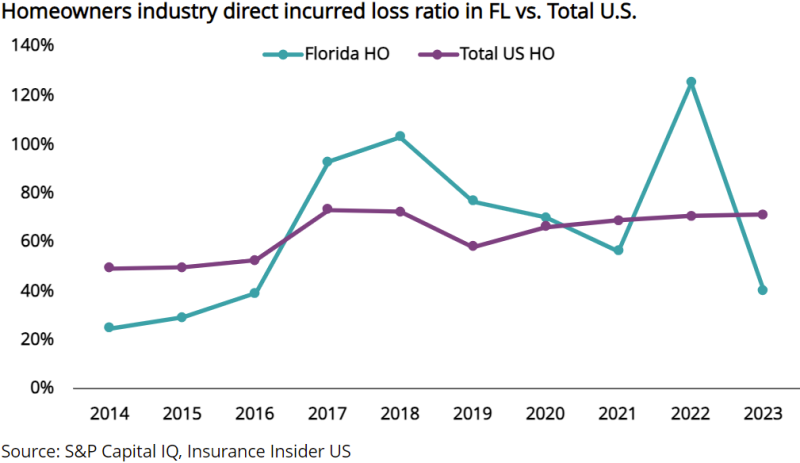
This very clearly shows the effect of the decline in hurricane activity over the past year after the 2022 peak caused by Ian. It is also interesting to note that Florida actually trended lower than the rest of the US before H-I-M in 2017.
With this radical shift in loss ratios showing up, the question becomes: Is this the dawn of a new day for Florida, or will we see things return to make-or-break when hurricane season ramps up in a few months?
Despite the drop off in hurricane losses year-over-year, surplus growth is much less than premium growth
The chart below shows how the surplus has shifted over time for the Floridians. Note that we are tracking the current cohort over time, meaning that the companies that have exited or failed are not included, and that the companies we have today appeared over the time frame shown.
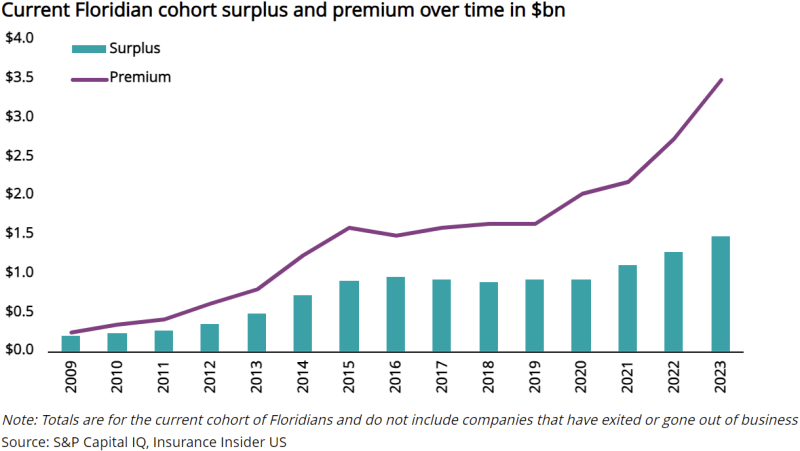
We can see several steady, increasing years of surplus growth from 2010 to 2016. Surplus then stagnated and declined in the wake of H-I-M, triggering a dry spell that lasted through 2020. Then, in the last three years, we have seen a turnaround and marginal growth as carriers have managed to stay afloat despite macro pressures.
However, in the context of the premium growth and the less active hurricane season, this surplus growth could be viewed as minimal. Conversely, business written against the same capital base has raised questions regarding the level of premium leverage appropriate for this marketplace.
In summary, we are seeing improvement in the results, but that does not mean the tide has turned for these carriers. This positive shift coincides with a low hurricane year. Consequently, we are not fully convinced that this sector is out of the woods or that the results necessarily indicate a change in the underlying quality of the players. We hope to see how these companies react to another active hurricane season as well as whether their diversification and risk management efforts pay off.
