
Our statutory data deep dive last week dug into the recent changes in Florida. California is another state that has taken a more recent turn into troubling territory, with 2023 bringing announcements of exits or pullbacks from several large carriers.
The note below takes a look at the shifting trends for personal lines carriers operating in the state using the recently available 2023 data.
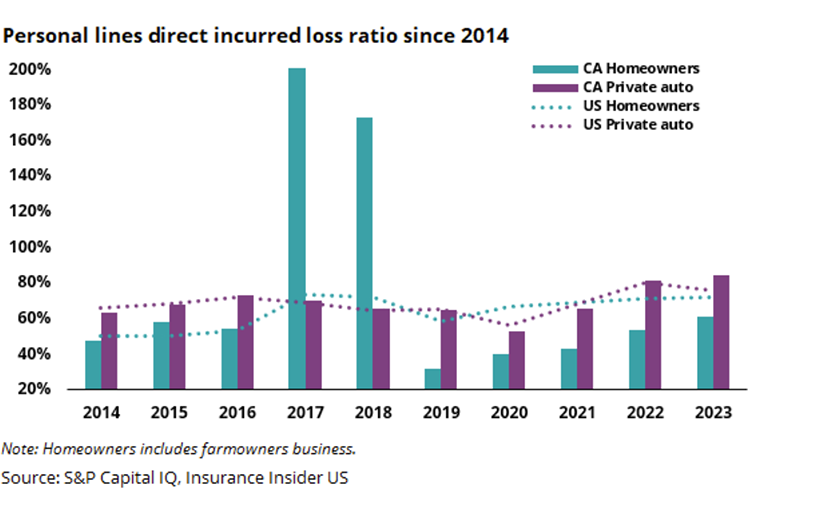
California matches industry trends in personal auto but beats the industry in homeowners'''' results…when there are no wildfires
In our monthly CPI and rate filing pieces, we have discussed the trajectory of homeowners' and auto in the wake of extreme pressures on both lines, driven by supply chain issues, weather events, and inflation.
With California holding 12% of the country’s population, we might expect it to largely follow and drive industry trends. However, this past year’s mid-double digit rate actions, the prior moratorium on personal auto rates, and extreme losses from wildfires mean results are unpredictable.
The chart below shows how both these factors play out. We can see personal auto almost exactly traces the industry trendline, turning around this past year as rate action took effect and inflation cooled down.
The private auto decline is driven by the aforementioned shifts. However, we should recall that the moratorium on rates only ended in October 2022, so this is a decent success story.
homeowners'' on the other hand has significantly beaten the industry since 2019. However, the massive wildfires in 2017 and 2018 pushed the loss ratios to two to three times their normal range.
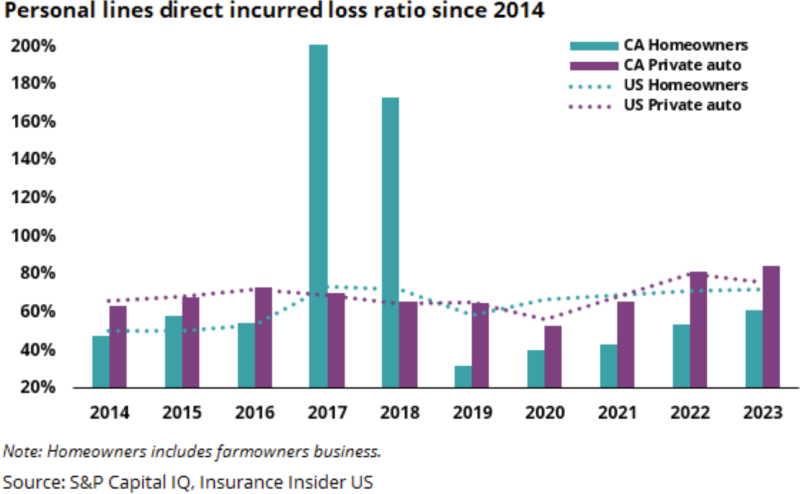
Though homeowners' has been in a reasonable range more years than not, those spikes make it clear why we have seen more and more carriers announcing they will not pursue any new business in the state. The losses are significant enough to offset any benefit of the intervening calm years.
A carrier-level analysis shows companies are still struggling to balance rates vs. loss costs
We dug a level deeper into the stat data, pulling premium and direct simple combined ratio by carrier.
Note: The direct simple combined ratio excludes certain expense items that are not reported at the state level. Consequently, the 100% mark cannot serve as a breakeven point, and this data should only be looked at directionally rather than compared to standard combined ratios. Recent years have shown an uptick in loss adjustment expense and hence the actual gap would be worse.
Looking at the chart below, we can see only a marginal uptick in premium for homeowners' and personal auto at 10% and 11% respectively. Given the context of the carrier exits, this makes sense, with the small change coming from the net of the significant pullbacks (-) and the major increases in rates (+). However, despite a minimal shift in the premium, we can see the combined ratios have moved materially for the group, with an 8pt worsening in homeowners', and just under 3pts in private auto.
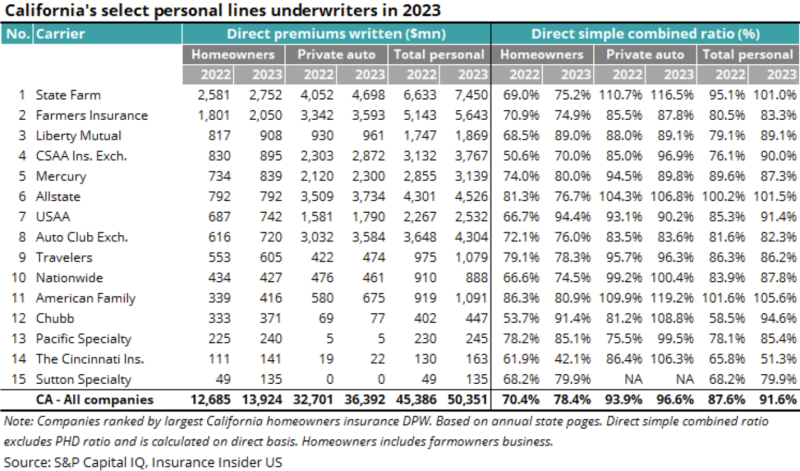
Looking at the list name by name, we can see there is quite a bit of disparity, particularly in homeowners' where the 2023 ratios range from 42.1% to 94.4%. In terms of the shift from 2022, only four companies improved in homeowners' year-over-year, with other companies worsening by as much as 37.7pts.
The story was slightly better in personal auto with only two improving their ratios, but with the negative shifts smaller, the worst being a 27.6pt decline by Chubb.
Seeing the results by carrier and the divergence in trends makes some of the exits make more sense, as compared to the larger overall trend shown at the beginning, which was only marginally negative.
State-level difficulties have led to a fluctuating carrier pool
Though 2022 was a year of many exits, this is hardly the first difficult year for California carriers, as the pressures of litigation and regulation in addition to natural disasters have plagued the state for years.
We give a proxy for the entry/exit numbers below with the number of statutory entities in the state over time. The decline in personal auto is marked, and has been almost constant with the exception of the 2013-2016 period. It is interesting to see we do not have a rebound post-moratorium and rate increases, though it is possible that will develop over the next years.
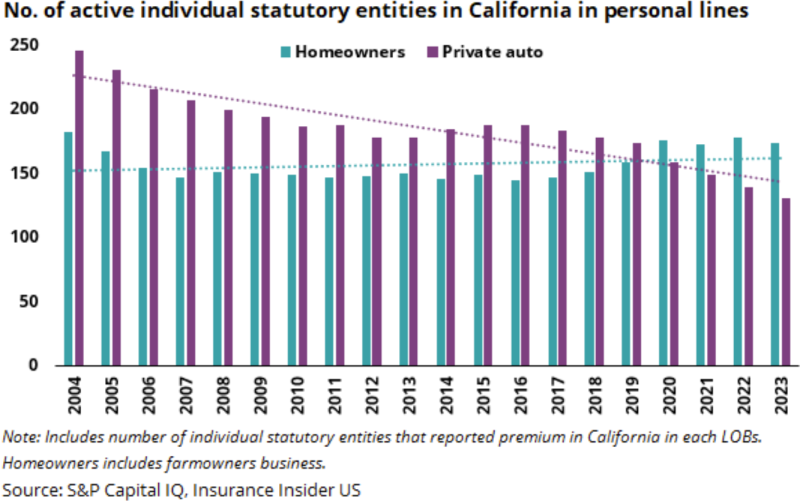
On the other hand, looking at the teal bars and line, homeowners' entities are actually increasing over the longer-term, though they are down year-on-year in 2023 as they should be based on the news. The graph is surprising in that we don’t see drop offs after major events like the Tubbs or Camp fires – in fact the counts increase after those dates. It’s possible that, at the time, the fires may have seemed like random events, and as the trend became clearer over these past years, it drove some of the carriers to action.
Despite pressures, the data does not show carriers moving out of state…yet
The charts below show how concentrated carriers are in California based on the percent of their total US premium that is in the state. We’ve tracked the metric over time to see if carriers have noticeably increased or decreased their concentration there as part of their geographic strategy.
Despite the variety of issues that carriers have faced, only Mercury has made any real shift out of state. However, this should be seen as an expansion rather than a pullback as they are a California-based carrier. In fact, some other carriers have even increased their concentration.
The more interesting thing to notice is that the number of pink cells has increased in the last two years, compared to prior years. In other words, carriers were moving slightly up and down before, but now there is a more unanimous inching out of state.
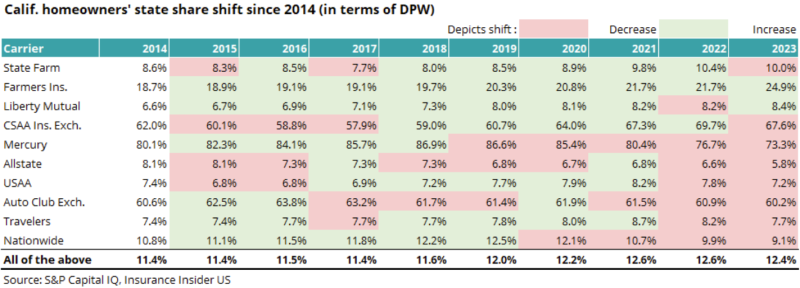
This comes as five major carriers accounting for 45% of the market – Progressive, State Farm, Allstate, Nationwide and Farmers – announced significant exposure reduction plans for homeowners’ business in California in H1 2023.
A broader concern for private market carriers in the state is the huge growth in the California Fair Plan, given its ballooning exposures and its ability to place surcharges on carriers in the event it takes major losses it cannot finance.
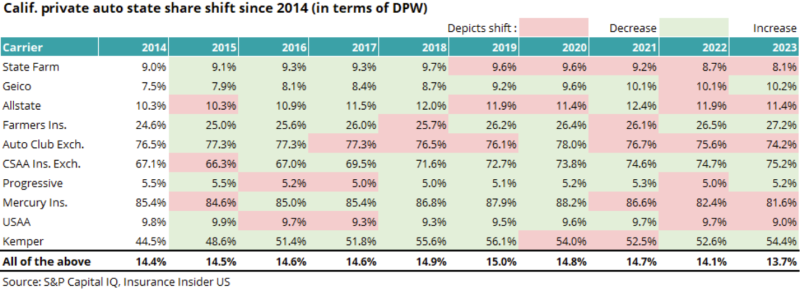
The same trend is apparent in personal auto, though to a lesser extent. This might be better characterized as little more than noise though, as the shifts are for the most part less than a point. The most noteworthy shift here is Geico, the second largest in the state, which has been slowly increasing California business to 10% of its book. Among smaller carriers, Kemper has increased to over half its book.
However, the above analysis is somewhat limited in showing any potential trends, as a pullback from new business or intent to start non-renewing certain policies would take months to years to make its way through the books.
The key takeaway is that we are not seeing any indication that this is the next Florida, where we have seen multiple mass exoduses of nationals over time as conditions became untenable.
While the announced exits suggest serious struggles, surplus remains steady, with a small dip due to unrealized losses and underwriting pressures.
In news releases regarding carrier exits and subsequent earnings calls, carriers have unanimously cited the increasingly difficult insurance landscape in the state as the cause for their changing strategies.
With all of these pressures and mounting losses, we might expect to see a major shift in the surplus for the cohort, but the chart shows only a moderate drop from 2021 to 2022. However, that drop was driven largely by unrealized losses, which were a major factor at the time.
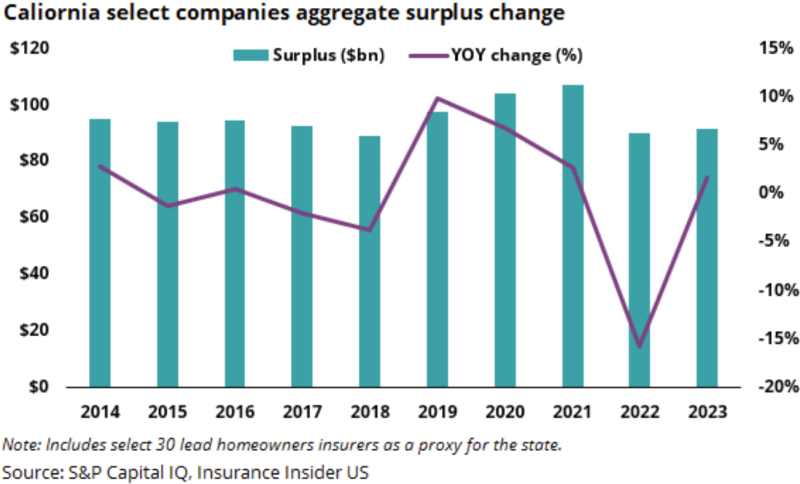
Perhaps more concerning is how minimal the recovery has been in 2023 despite the reversal in the markets. It is possible that although the surplus increased, what we are actually seeing is more evidence of the struggles.
Taking a step back, we can foresee a continued decline over time as natural disasters increase and social inflation continues to be a headwind.
In summary, loss ratios for California show that the state's homeowners' sector continues to face difficulties from the various headwinds, particularly wildfires. This has driven the exit announcements from several companies over the last, but the data shows that these have not fully taken effect yet. Despite the various difficulties, surplus has remained steady. We remain cautious on this sector, as continuing wildfire trends and a difficult regulatory environment will likely continue to create problems for these carriers and eventually force additional exits.