
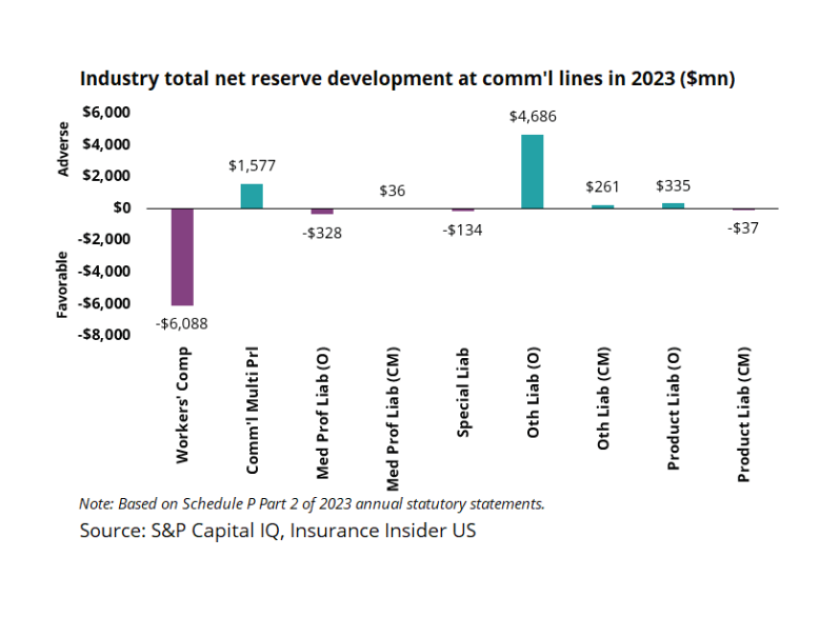
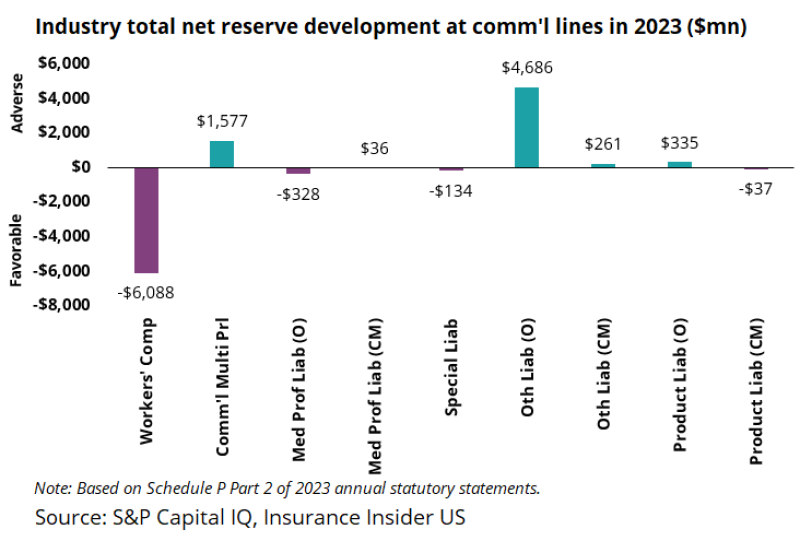
Our recent notes on stat data trends have shown workers' compensation releases offsetting the adverse reserve development of other liability lines in 2023.
The chart below shows the industry net reserve development by major commercial LOB, demonstrating magnitude and direction, and how they offset.
Our note below expands on the work from our recent reserving notes, focusing on the trends in loss pick development and IBNR as a percentage of total reserves.
Initial vs. ultimate loss pick development trend leaves room for future bad news
The chart below shows initial vs. ultimate loss ratios for the nine combined commercial lines. But why compare these two numbers?
The initial loss ratios are based on the carriers/industry’s initial estimates, made just after these policies are written but before claims have developed.
Ultimate loss ratios, on the other hand, reflect the fully developed losses for claims, including re-estimates and unexpected losses that have occurred during the intervening years.
By comparing the ultimate ratio to the initial, we can gain insight into how far the industry has veered from the anticipated pattern, which reveals whether the industry is generally being over optimistic, or overly conservative.
As might be expected, the chart below shows a wider variance between these values during the soft market years. It also shows the industry moving down on estimates for relatively immature years, which could signal trouble if loss costs worsen, and these moves were premature.
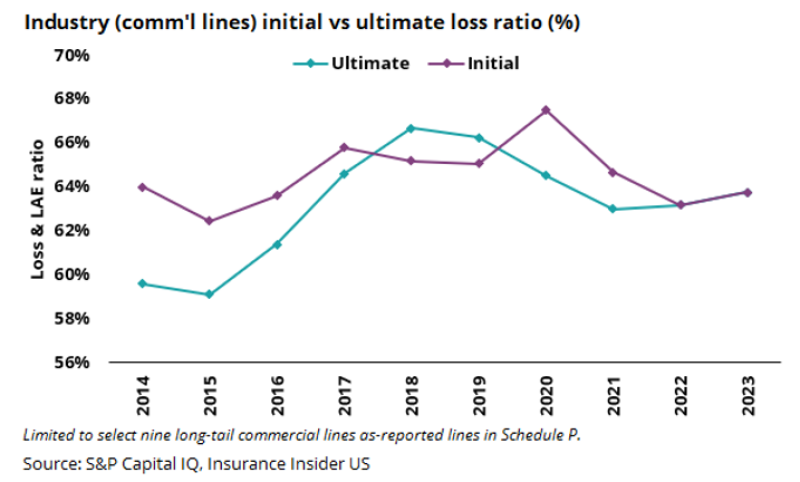
While it is theoretically possible that the ultimate loss picks for 2020 and 2021 could stay lower than the initial, we have seen a lot of worrying movement in older accident years. This leads us to believe some degree of caution is warranted, especially given the extremely uncertain inflation and interest rate environment.
An increasing percentage of IBNR will likely impact carrier earnings as loss costs worsen
Another related trend is the development of IBNR over time. IBNR stands for incurred-but not-reported reserves and, as the name suggests, it is a carrier’s estimate of reserves for claims that have occurred but have not yet been reported. These reflect the carriers/industry’s actuarial perception of overall loss trends and their book of business on an aggregate basis.
Tracking the course of IBNR as a percentage of total reserves over time gives us insight into reported loss patterns and the shifts in the book of business. Typically, IBNR percentages would be higher for longer-tailed lines, as the carrier is estimating total losses over a much longer forward-looking period.
Shifts in IBNR patterns can also reflect earnings management – where carriers might be slow to recognize worsening patterns or report lower earnings.
The charts below show the shift in IBNR for workers’ compensation and other liability. On an overall basis, they are striking. The chart on the left (workers’ comp) shows the level of IBNR as a percentage of reserves flatlining over the past few years. This connects well with our prior analysis, which showed a higher level of release in workers' compensation in recent years. The problem is, if the actual case patterns come in hotter than this trendline suggests, the aggregate IBNR would need adjustments, translating into lower earnings.
On the right side, other liability (occurrence), which has been a sore spot for the industry, shows the IBNR reserves for prior years have proven inadequate and necessitate adjustments, and the recent years’ picks have continued to climb.
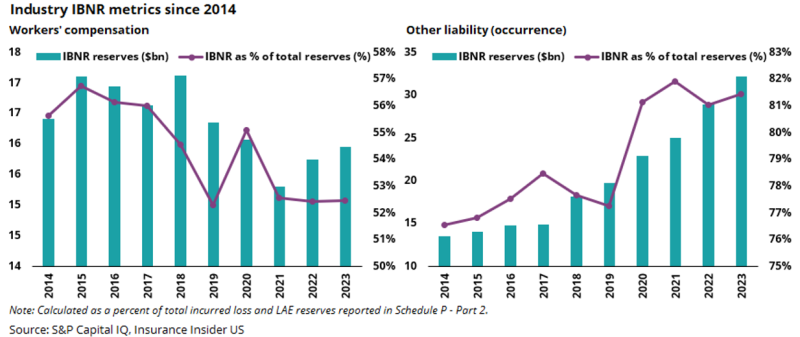
The takeaway here is that while workers’ comp shows positive trends, it is flatlining, and could easily reverse. IBNR has been inadequate for other liability, as already shown. This trend development is likely to mean we will see an impact in carrier earnings, as the IBNR number is adjusted to account for these shifting trends.
IBNR trends by carrier show this is an industry-level problem, not one of troubled franchises
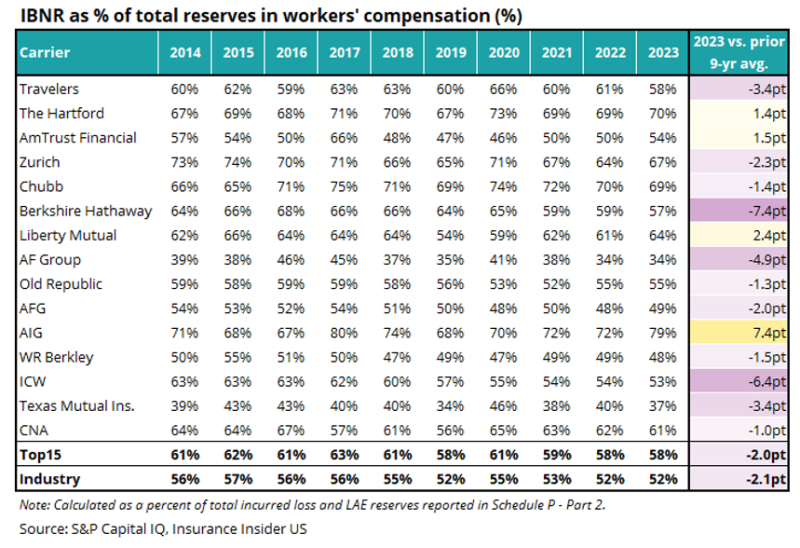
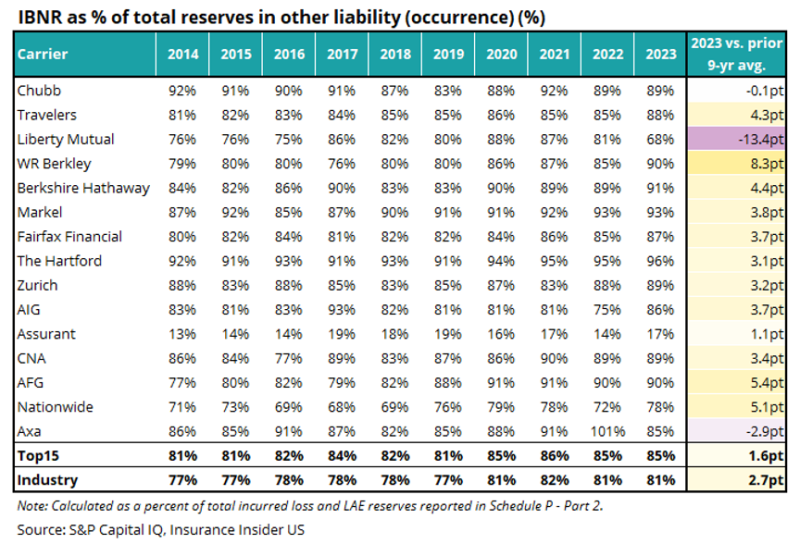
Following on the overall line of business charts above, our next step was to dig into the IBNR by carrier over time. The charts below show how IBNR levels have developed since 2014. We also show how 2023 compares to the average of the prior nine years.
Note that this analysis is simplistic, and a full analysis would need to examine the type of book and state-level exposure to better understand the situation.
The comparison between 2023 and the nine-year average shows that IBNR has trended down for workers' comp. This leads to two possible conclusions: First, the trend is positive, with the industry frequently overestimating aggregate IBNR levels. Second, the industry is being too optimistic and expects the current run of positive loss cost trends in this line to continue. We believe the second case is true. If the loss trends shift and social inflation picks up, the industry might have to revisit its loss picks.
On the other hand, for other liability (occurrence), the level of IBNR has ticked up, almost across the board. But is this a slow tweak or a complete acceptance of a shift in trends? We continue to remain nervous, and the ultimate loss picks could likely see some deterioration over time if social inflation comes in hotter in this line.
In summary, the competing trends shown above in IBNR levels for workers’ comp and other liability (occurrence) need to be viewed against the changing social inflation landscape. If trends continue to worsen, which is our house view, we believe that IBNR levels will climb, translating into lower earnings in that period.