
According to the familiar adage, you have to spend money to make money. Essentially, you have to invest to generate commensurate returns. But there isn't a perfect correlation between the two. In our piece below, we look at the industry, commercial, and personal lines expense trends and highlight the shifting patterns between the two through Covid-19 and in recent years.
For this analysis, we use statutory accounting principles for calculating expense ratios, using NPW as the denominator.
These points are discussed in detail below:
Expenses as a percentage of NPW for the P&C industry have decreased, in part due to top-line growth
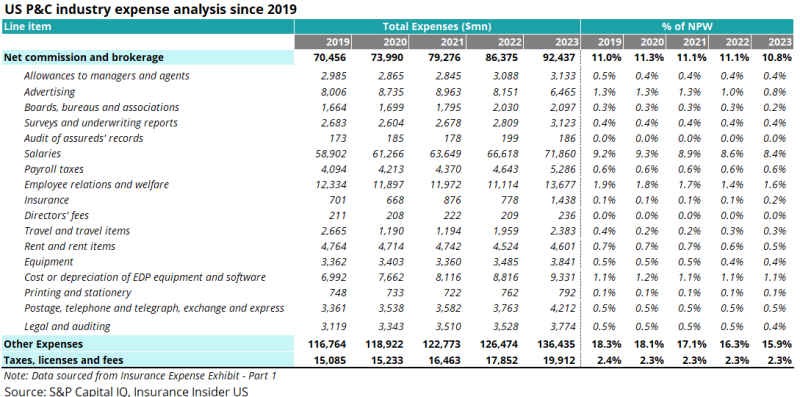
The table below shows a breakdown of the P&C industry’s expenses by line item in the past five years. We can see that net commission and brokerage (C&B) expenses as a percentage of NPW decreased year over year in 2023 and remain below pre-Covid levels.
Several line items shown below are worth discussing in greater detail. Namely, advertising spiked in the pandemic years but has since tapered off. Salaries also increased during that time and remain elevated, due in large part to ongoing wage cost inflation.
Though salaries are still significantly higher than pre-Covid levels, salary expenses as a percentage of NPW only increased marginally in 2020, by less than one percentage point.
Moreover, this percentage has only continued to decline sequentially, in part due to continued year-over-year top line growth across the industry. This shows that some of the hires made during that time on the commercial lines side did pay off in the near term, particularly given the recent uplift in the rating environment, although it will take some time for the book's quality to become more evident.
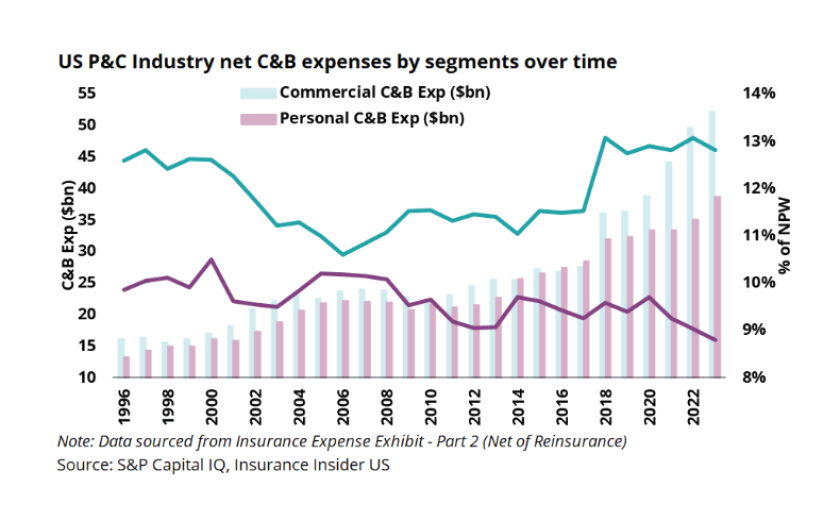
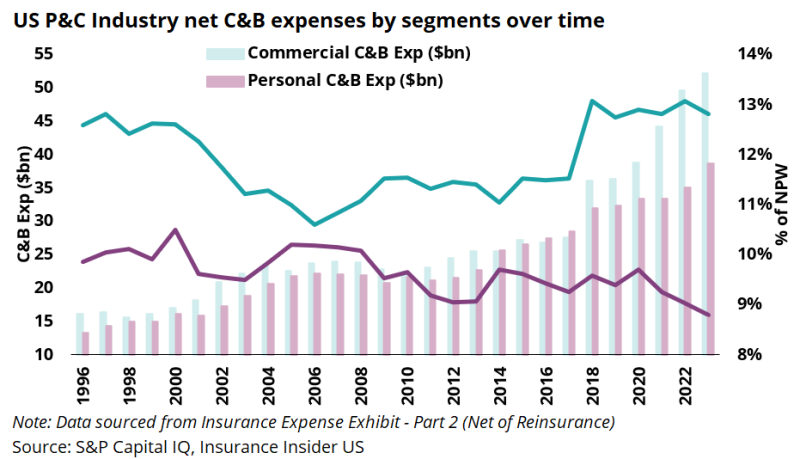
C&B expenses as a percentage of NPW remain stable for commercial carriers, but declined for personal carriers in the post-Covid years
The chart below shows C&B expenses on an absolute dollar basis and as a percentage of net premiums written.
The first signs of the industry's hard market caused a significant spike in 2018 for commercial lines. As rates continued to accelerate from 2019, premiums grew faster than commission expenses, explaining the plateauing of the teal line below. On the other hand, C&B for personal lines fell faster than the small year on year, as writers likely focused on the direct channel vs the agency channel.
Overall expense ratios for personal lines carriers increased in the first year of Covid, but decreased for commercial carriers during the same period
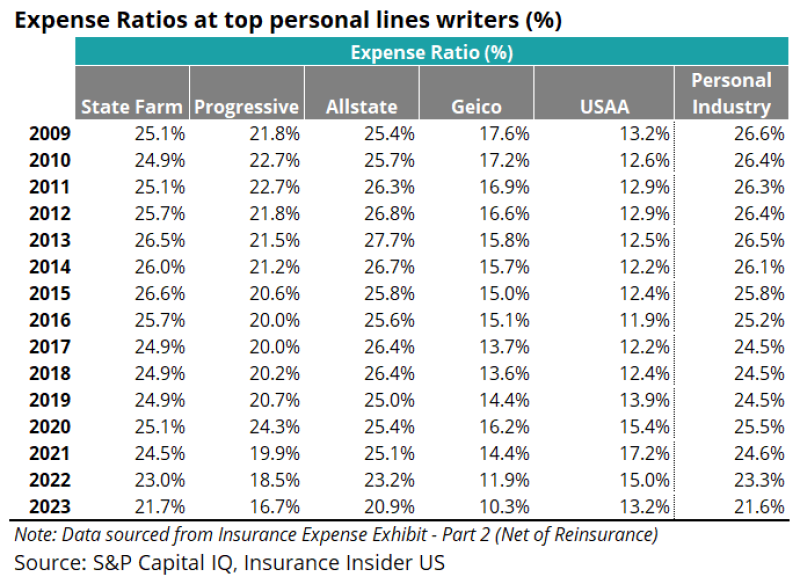
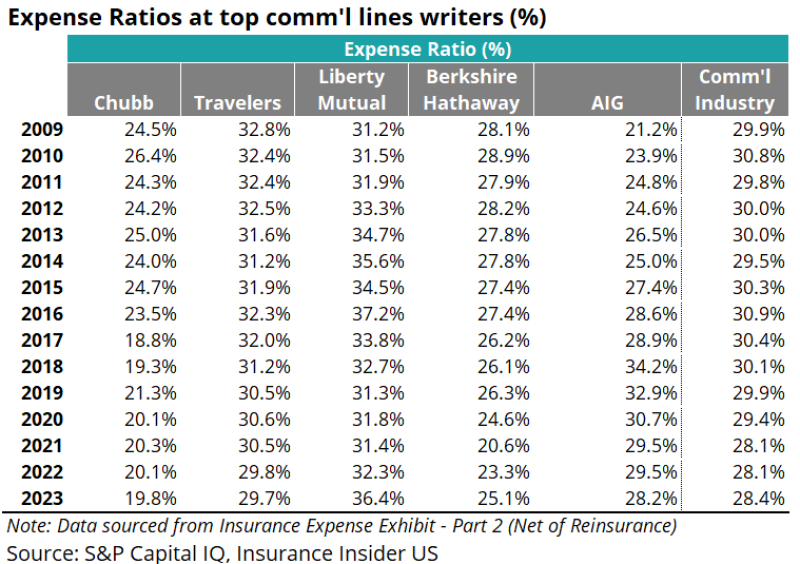
The tables below show the expense ratios for the top personal and commercial lines writers as well as the overall personal and commercial segments. Broadly, we see that the expense ratios for both segments remain below their pre-Covid levels as of 2023. However, a closer look reveals a divergence in expenses between the segments, specifically in the first year of the Covid-19 pandemic.
Looking at personal lines writers, we can see that the segment experienced a notable increase in its expense ratio in 2020, before declining slightly in 2021 and continuing to taper off since. This uptick in the first year of the pandemic is primarily attributable to segment-wide increases in C&B and general expenses in 2020, which have since reversed.
When considering the top players, it should be noted that Geico and USAA have less overall C&B sales than State Farm, Allstate and Progressive. This is because Geico and USAA primarily sell their personal lines products directly to their consumers rather than through agency channels. Therefore, the companies’ expense ratios are generally lower.
Unlike the personal segment, we can see in the table below that the expense ratio for the commercial segment decreased in 2020, after which it leveled off for two years before a slight rise of less than one percentage point to 28.4% in 2023.
In summary, expenses have increased overall in absolute terms, but have decreased as a percentage of NPW due to consistent year-over-year top-line growth industry-wide. Both personal and commercial lines carriers experienced an uptick in C&B expenditure in the first year of Covid. Spending on C&B by commercials remained largely stable in the years following, whereas spending by personal carriers sequentially declined.
As the market moves into a more uncertain loss cost environment, managing expenses will become increasingly important.