

As we head towards the final peak of second-quarter earnings, it is becoming clear that Progressive's noise was not an outlier, as suggested in our prior research note. Last week we heard from several other players, including Travelers, The Hartford, Cincinnati Financial, Chubb and Universal Insurance.
The noise in second-quarter numbers is due to factors including loss trends related to property damage and bodily injury, litigation and regulatory challenges.
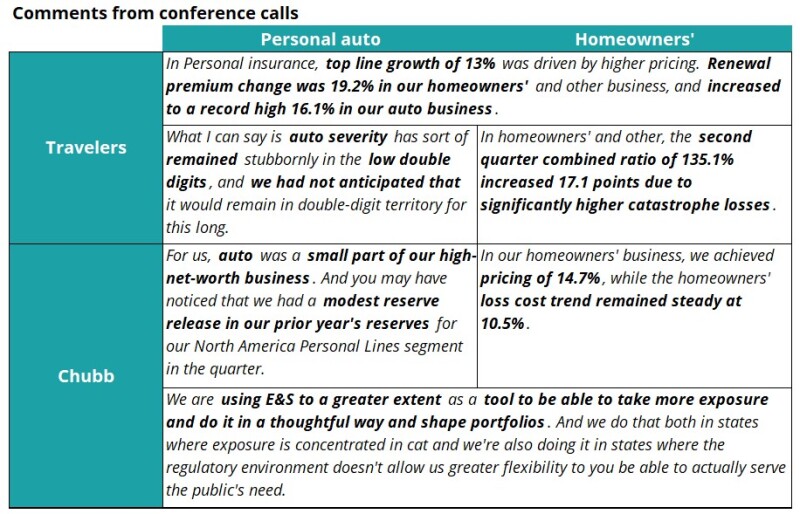
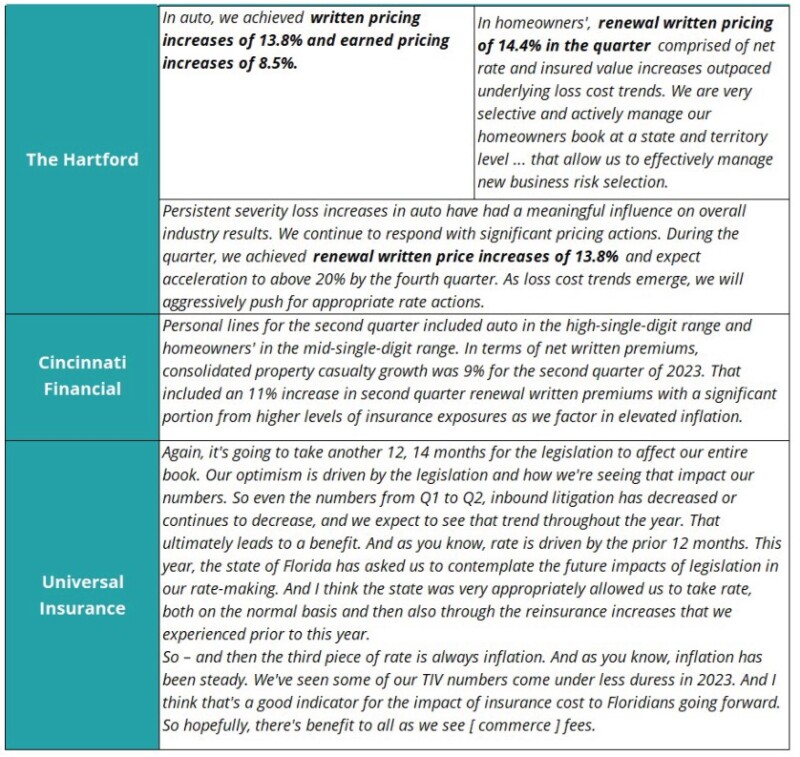
The table below shows select comments made on these earnings conference calls.
Against this backdrop, we refreshed our rate filing analysis for July for personal auto and homeowners’. Our prior analysis has focused chiefly on weighted average rate change and the six-month rolling average for these lines.
For this monthly analysis, we were curious to see how the absolute number of rate filings has looked over time and whether there has been a perceptible shift in that trend line. The analysis highlights these trends in both personal auto and homeowners’.
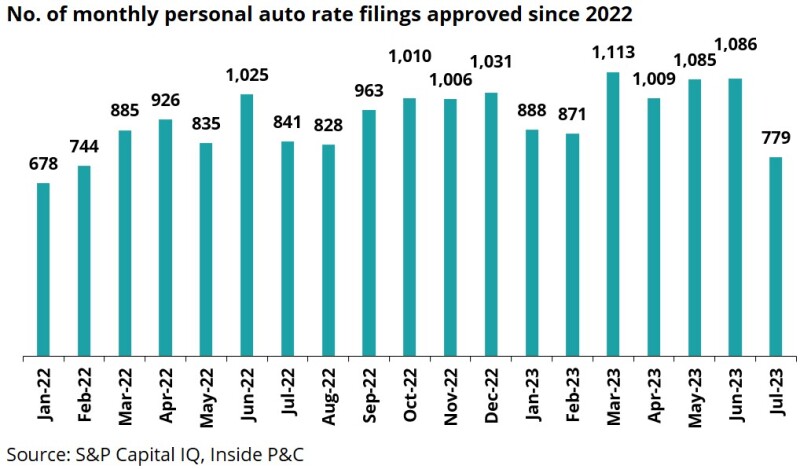
Monthly personal auto filings fall to 17-month low
One of the interesting trends when looking at the absolute number of rate filings is how the number has progressed over the past year or so. This number fell to 779 filings for July, the lowest since February of 2022.
This shows that insurers have slowed down the process and are focused on getting it right this time vs. the endless prior cycle of re-rating.
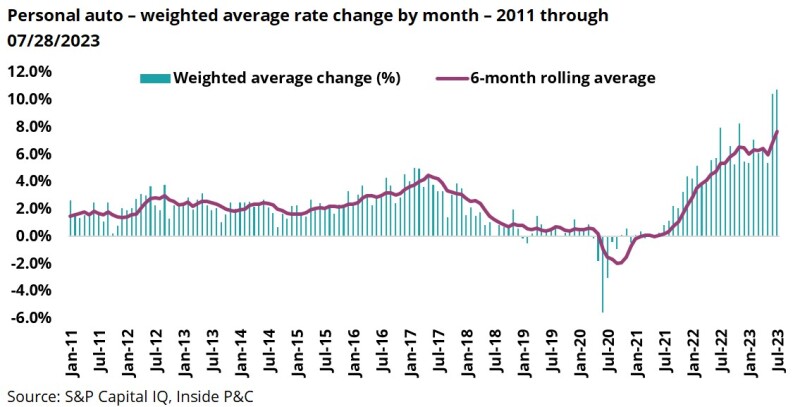
However, the weighted average rate change is the highest in over a decade
The following chart shows the monthly weighted average rate change for auto insurance and the six-month rolling average. We calculate the weighted average rate change as aggregate written premium change for all rate filings approved each month as a percentage of the largest rate filing written premium for each filer. This analysis excludes rate filings approved in Florida, for which the necessary data is unavailable.
The latest number for July stands at +10.7%, while the six-month rolling average stands at 7.7%. Both numbers are the highest in over a decade.
With the continued level of pain demonstrated in the second-quarter results, we anticipate this line to trend up for the remainder of the year.
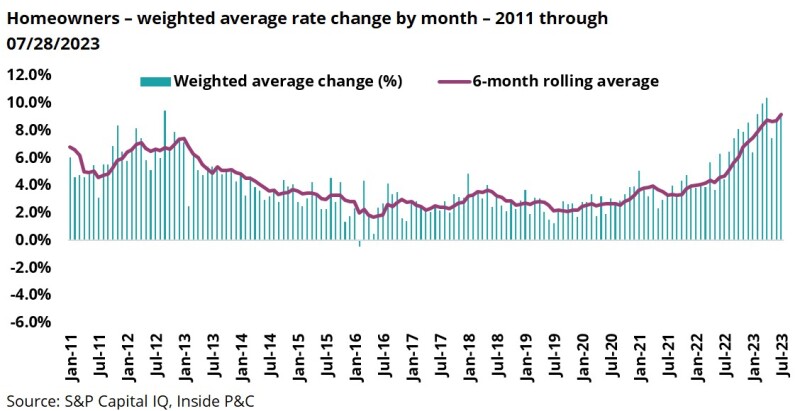
Homeowners' filings exhibit the same dichotomy in rates vs. number of filings
The chart below shows the number of monthly homeowners’ rate filings across the US. Filings fell to an historic low for July 2023. Recent months have shown a gap emerging between insurance companies' rate needs vs. state regulators' expectations.
This difference has also played in several homeowners' franchises, either officially exiting problem states or taking actions to re-underwrite and manage exposures.
The following chart shows the monthly weighted average change for homeowners for July which, after dipping a tad for the past two months, has once again resumed its climb back to closer to double-digit levels. The weighted average rate change for July was +9.1% vs. +8.8% for June.
Recent conference calls illustrate the new normal of greater-than-long-term-average non-cat losses, with losses from severe convective storms reaching $20bn-$30bn in the second quarter alone.
This level of losses and profitability targets for personal lines insurers will continue to impact their top line and rate activity for 2023. Additionally, we are approaching peak hurricane season.
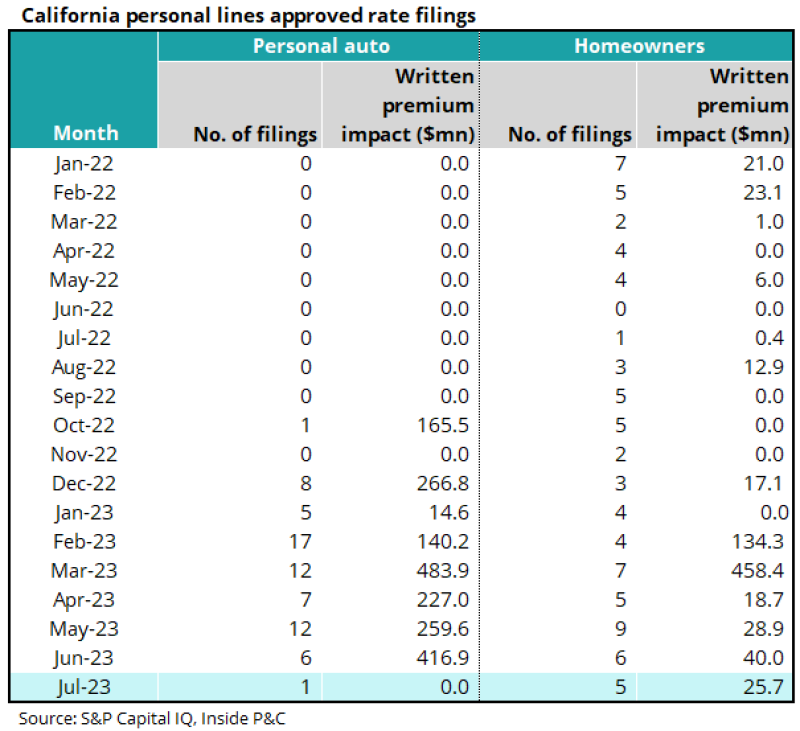
On a state basis, the California logjam illustrates a persistent problem in this marketplace
The table below shows rate filings and the written premium impact from January 2022 in California. Although the state’s insurance commissioner has used the correct soundbites, what is missing is the leadership needed to see California through this crisis.
For both personal auto and homeowners’, rate filing activity has ground to a halt as insurers consider how to navigate this environment. Our prior piece on State Farm showed that it takes an average of 200 days to get rate approval in California, which is likely playing a role in the slowdown in rate filing activity.
In summary, recent rate filing activity shows that insurers are still in the “figuring it out” phase as they ponder the level of rate activity needed to navigate the double whammy of adverse loss trends and an increase in non-catastrophe weather. We anticipate that our analysis in the coming months will show a similar uptick to that seen in the July numbers.