When we talk about reserves, we often use the cookie jar analogy. You estimate the number of cookies you'll need based on previous patterns, similar to how insurers calculate their reserves by examining past claims.
However, suppose people start eating the cookies sooner than expected, perhaps due to guests arriving early. In that case, you might run out before your next baking day, mirroring insurers who face claims earlier than anticipated, which can strain their reserves.
Or you can raid the cookie jar early since you are hungry, and when the guests (claims) show up, there will not be enough cookies left. This push-and-pull issue has been front and center over the past year as insurers grapple with a changing loss cost environment and prior period reserve movements in the 2015-2019 reserves.
Against that backdrop, we looked at the industry Schedule P triangles to project where we stand on reserves and the visible trends.
First, based on our analysis of the 2023 data, we believe that there are redundant reserves of $7.3bn, or 0.8% of the total reserve amount of $863bn. A material piece of this redundancy is in workers' compensation, partially offset by other liability lines.
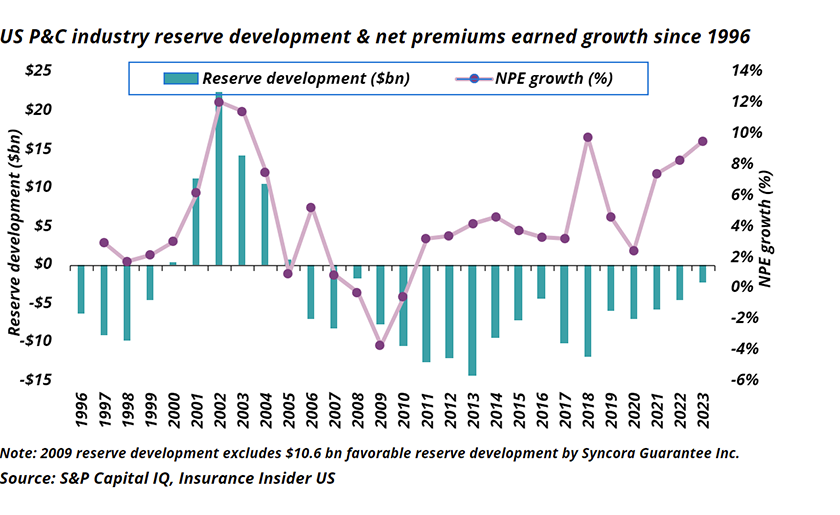
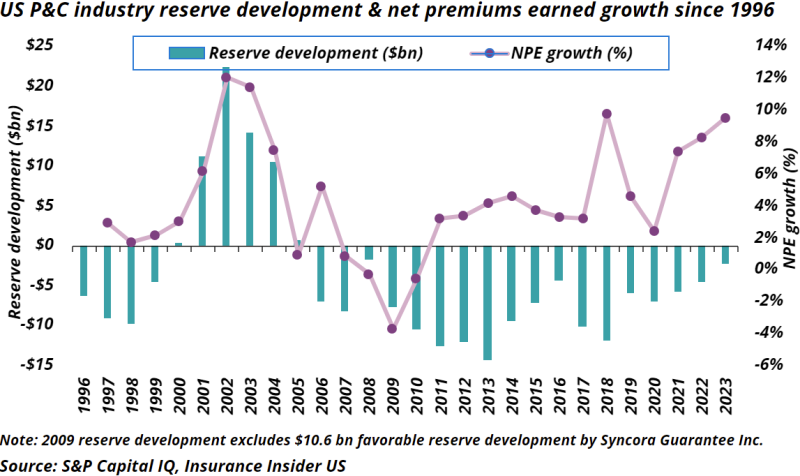
Second, reserve releases for 2023 were $2.3 bn or 0.3% of 2022 reserves. Although meaningful, they have decreased from $4.6bn in 2022, $5.9bn in 2021 and $7bn in 2020. If loss cost inflation and social inflation rear their head at a faster pace, this trend could reverse quicker than anticipated.
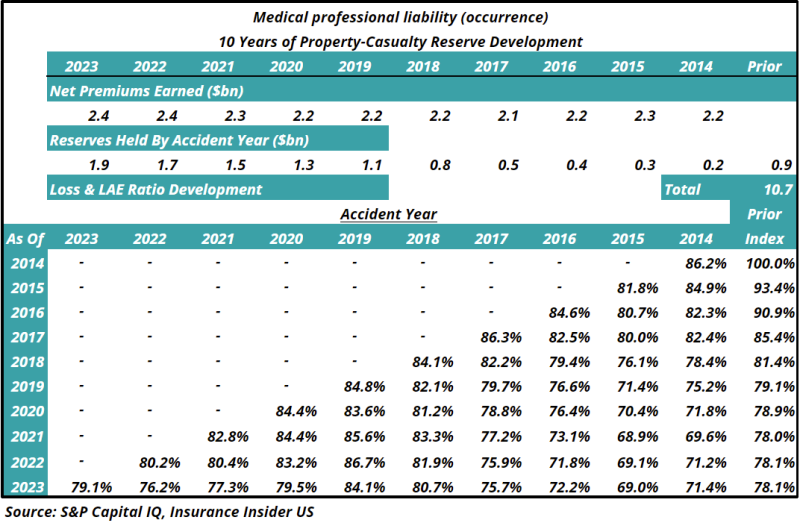
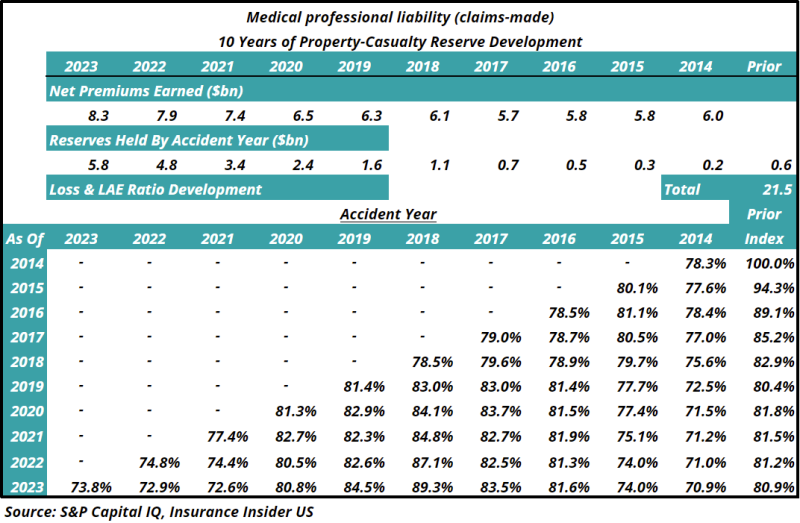
Third, based on our sector-level analysis, we remain cautious about other liability, commercial auto, and medical malpractice. Since workers’ compensation reserve releases have offset any negative movement from these lines in 2023, we will remain incrementally cautious on this, especially if wage and medical cost trends continue to run hotter than expected.
First, reserve analysis shows a cushion of $7.3bn redundancy
The chart below shows a reserve analysis by line of business, with the earned premium, reserves, and an estimate of the redundancy or deficiency. We have included results for widely accepted reserve analysis methods (paid-to-incurred and reported-to-incurred) and a "selected" column that adds our view (your view might differ).
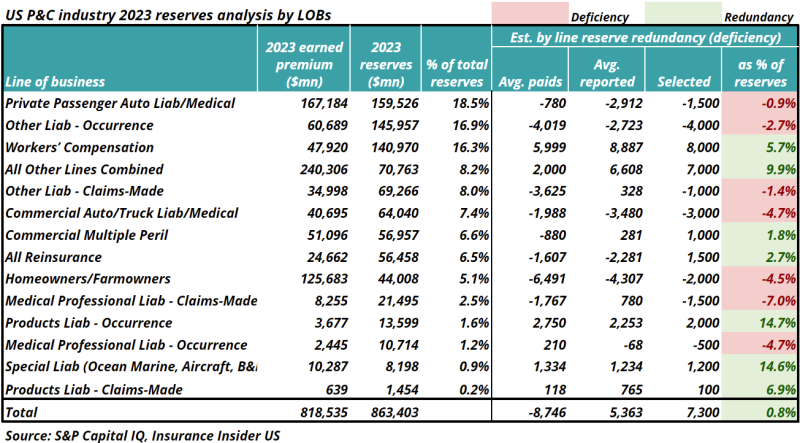
Overall, the industry has a redundancy of $7.3bn. This is primarily driven by workers' comp with $8bn. We also find that other liability is deficient by $5bn, commercial auto by $3bn, and medical malpractice by $2bn.
Second, net reserve releases continue to trend down and were at the second-lowest level since 1996
The chart below shows 26 years of reserve development and net earned premium growth. Note the seven-to-10-year cycle over time, as we are closer to an inflection.
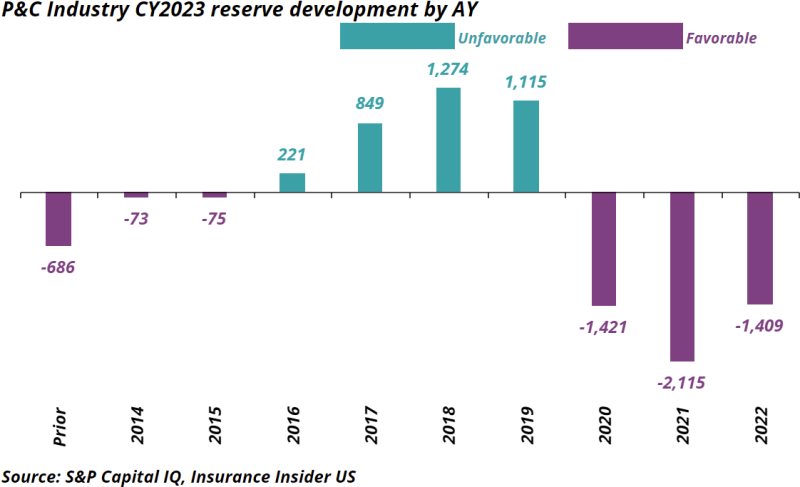
As shown below, trends appear even worse when looking at the contribution by different accident years. We would not be surprised to see AY 2015 and AY 2014 flip into the adverse territory by next year as well.
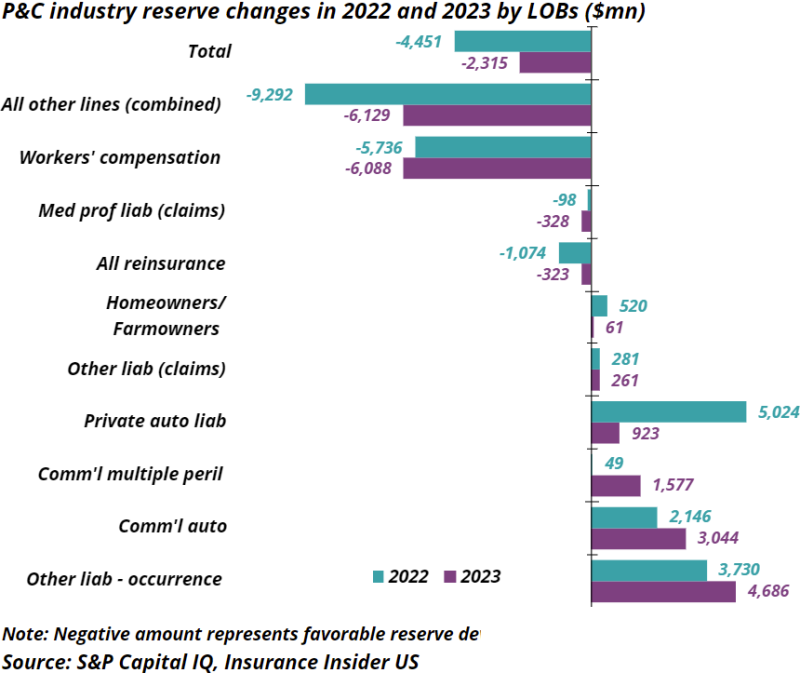
The chart below shows releases by segment. Note the benefit from workers comp and all other lines (this includes special property, financial and mortgage guaranty) doing the heavy lifting of releases. However, the more significant concern is the other liability occurrence piece and commercial auto, both of which remain problematic.
Thirdly, a segmental view unmasks the overall trends, which wrongly portrays stability
The overall triangles shown below look stable. However, one must skip over these and look at the by-segment trends.
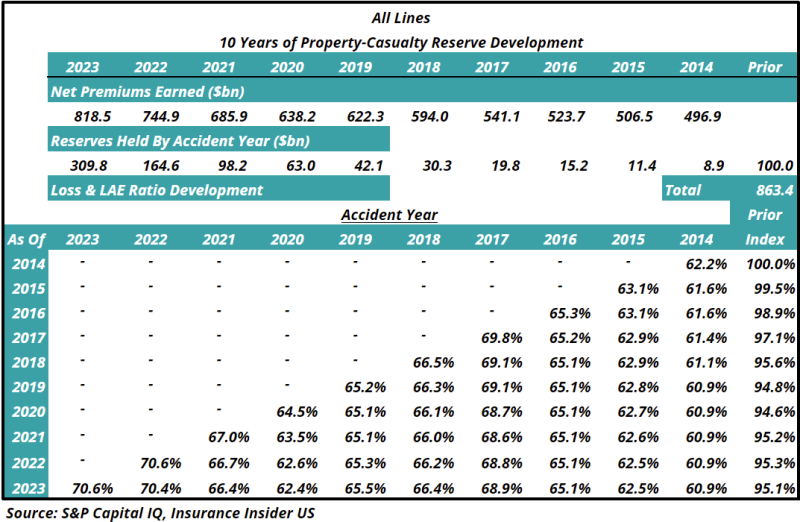
The other liability triangles reveal these challenges. Looking at accident years 2014 to 2021, all of them have deteriorated sequentially and will likely show continued deterioration into 2025.
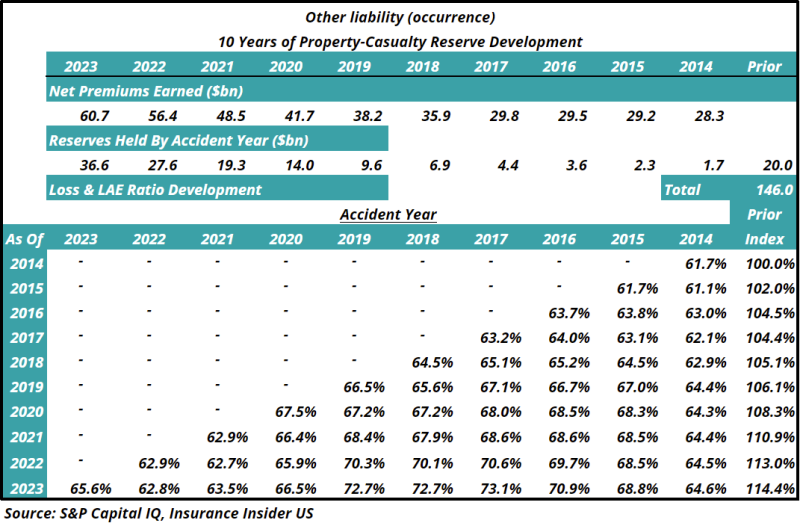
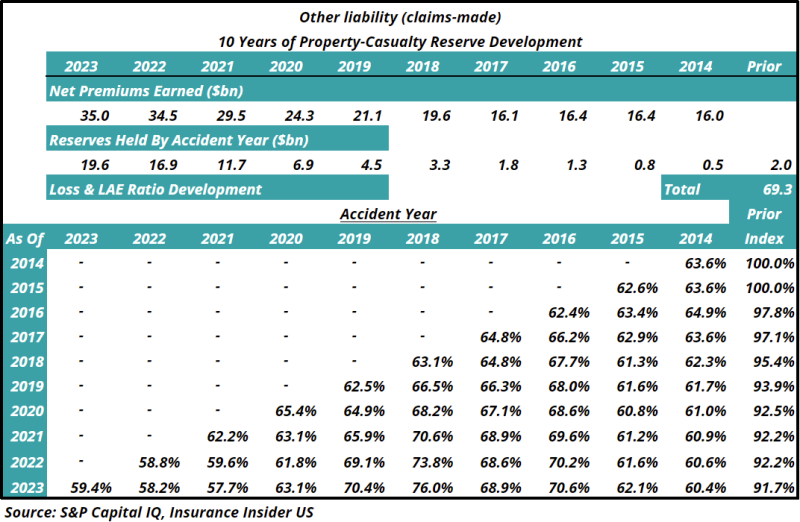
A somewhat similar behavior is also seen in claims-made policies. Although claims-made policies will have a shorter tail, most have a retroactive date earlier than the policy period time frame.
On the other hand, at least on the surface, workers' compensation loss picks might show a stable loss cost scenario. We would caution against that, as you can see companies already taking down loss picks in recent years (recall our cookie jar analogy).
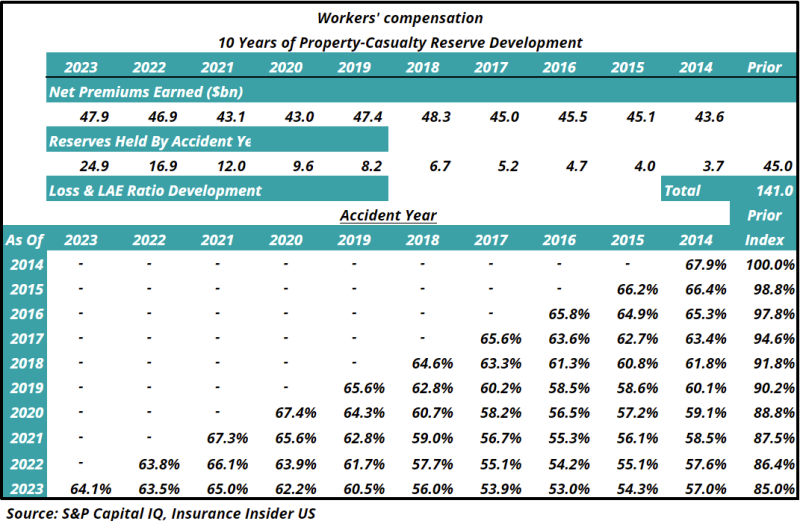
In summary, reserves over 2023 deteriorated but continued workers' compensation releases masked some of this. When peeling back the layers, other liability soft market years are troublesome. We remain cautious and believe additional strengthening will be needed over 2024 since this cookie jar is running empty.
APPENDIX
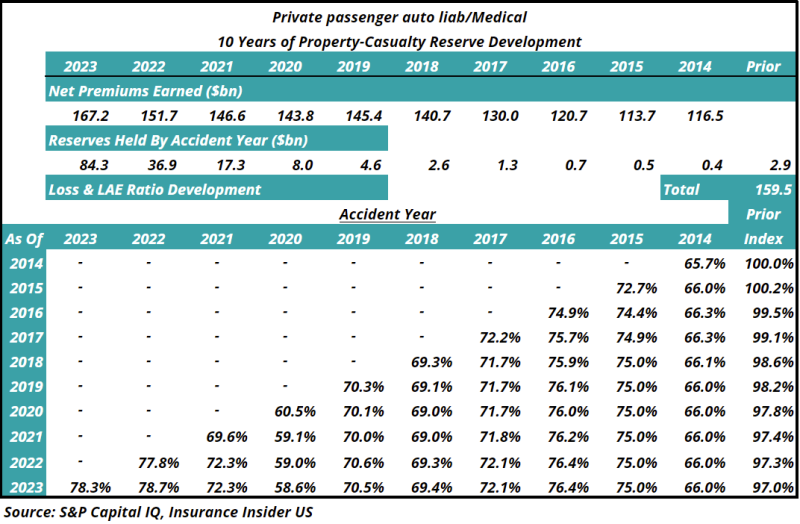
1. Note the increase in loss reserves over time for private auto, other liability, and commercial auto while workers' compensation has decreased.
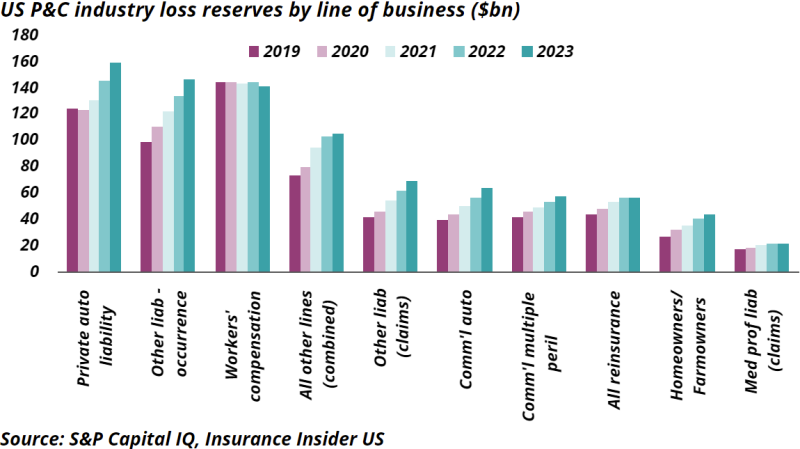
2. Some signs of reserving stability emerge in private auto, but caution is warranted based on CPI trends.
3. Med-mal could be another hot spot if loss cost inflation continues to worsen.
