WR Berkley Q1: Rob Berkley's highlighted reserving metrics vs the industry
  • X
  • LinkedIn
  • Show more sharing options
  • Copy Link URLCopied!
  • Print
  • X
  • LinkedIn
© 2024 Insider International Limited, company number 15236286, 4 Bouverie Street, London, EC4Y 8AX. Part of the Delinian Group. All rights reserved.

Accessibility | Terms of Use | Privacy Policy | Modern Slavery Statement

WR Berkley Q1: Rob Berkley's highlighted reserving metrics vs the industry

Focus on reserves to continue as gap between cautious reservists and others emerges.

  • X
  • LinkedIn
  • Show more sharing options
  • Copy Link URLCopied!
  • Print
  • X
  • LinkedIn
res main a.png

Yesterday morning, WR Berkley reported another strong quarter. As highlighted in our preview, the more prominent focus on the call quickly turned to reserves and market conditions. WR Berkley's stock did sell off and closed down 5.2%, as investors balanced the stock's valuation vs what appears to be peak rate hardening against the backdrop of a cautious reserving environment.

Although we have discussed these metrics in our prior pieces, revisiting some of them made sense considering the uneven reporting trajectory witnessed this season.

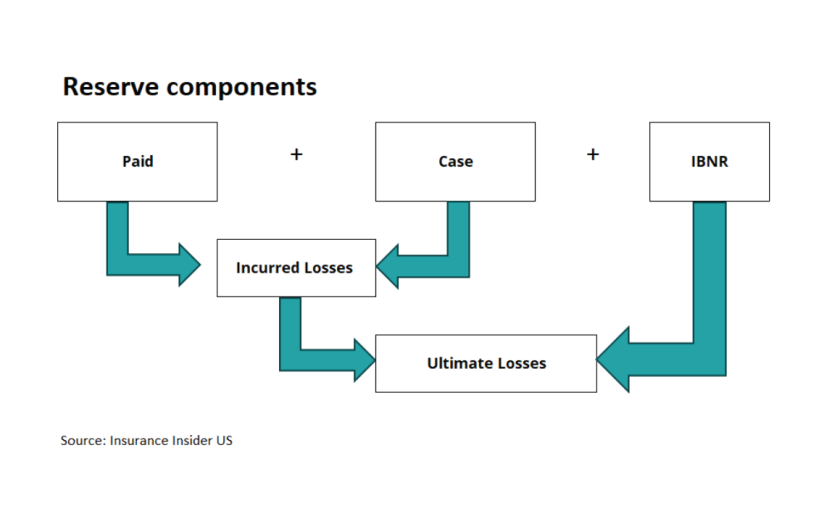
The flow chart below shows the relationship between various items when thinking about loss reserves. One can see the interlinkage between these items and mismanaging one will often have a ripple effect on overall reserving and profitability. Note: the flow chart is a simplistic version, and the phrase "bulk incurred" is also used to refer to ultimate losses. Other terminology differences may exist as well.

Res 1b.png

On the conference call, CEO Rob Berkley alluded to several measures. All these measures give an insight into the quality of an insurer's book and how it responds to the latest loss trends.

The measures included: (a) IBNR as a percentage of total reserves, (b) IBNR to case reserves ratio, and (c) paid loss ratio. There are also other measures which have been discussed in our industry and company reserving notes. For the purposes of this note we’ll focus on the three discussed on the earnings conference call:

First, IBNRs have trended up for the industry but unequally among the top commercial writers

Simplistically, a high IBNR reflects conservatism in reserve picks, while a lower IBNR can reflect optimism on loss cost trends vs the current book of business. A high IBNR translates into lower earnings since these are set aside from current earned premiums. Hence, every company must balance conservatism against the impact on reported ROEs.

The table below shows WR Berkley's IBNRs as a percentage of total reserves for general liability. The last column shows the difference between 2023 and the soft market years. WR Berkley’s IBNR percentages are now 10.9 points higher vs the industry trend of 6.5 points. A basic takeaway is that WR Berkley had addressed the changing loss cost environment vs the industry, although this assertion needs to be weighed against growth and business mix shifts.

res 2 ibnr as total.png

Second, paid loss ratios remain low

A low paid loss ratio signals prudent reserving and claims management, translating into underwriting profitability. The table below shows recent paid loss ratios vs soft market loss ratios. The last column shows the difference between these metrics and if paid losses remain low, it reflects additional conservatism in the book.

res 3 paid loss ratios.png

Third, IBNR to case reserve ratio has jumped for WR Berkley

The following table derives from the prior two points and compares IBNR to case reserves. Case reserves are an estimate of future payments for a specific claim or a group of claims and will also reflect the book's quality vs the social and loss inflation environment.

Over time, the industry ratios have trended up, as shown below. AIG's shift reflects corrective action made in its book. What is also interesting is the 2023 ratios vs the soft market years, and clearly WR Berkley is ahead of the industry and peer trends.

res 4 ibnr res.png

In summary, we expect a continued focus on loss reserves and reserving metrics. In our view, a separation between the prudent reservists and the rest of the class will continue to emerge over 2024 and 2025.

Topics

Gift this article