Last month, we discussed our reservations regarding the industry’s continued reserve releases, primarily due to inconsistent claims data. Our analysis noted a continued uptick in “other liability” claims count for 2023, while overall industry reserve releases for Q1 2024 also went up.
Recent earnings calls and industry observers have noted (see appendix) that results and reserves remain generally favorable in workers' compensation, and this has continued to drive the high level of reserve releases.
We thought it would be interesting to take a deeper look at the claims count for workers' comp. Over the past few years, another long-tail insurance line, medical malpractice, has witnessed adverse trends. For the purpose of this analysis, we also looked at its claims count trajectory for comparison.
One common thread tying all the long-tail lines is the impact of attorney involvement, often described as one of the components of social inflation in all claims. The level of attorney involvement varies by industry.
As expected, it’s the highest for medmal, and approximately 10-20% of claims end up in litigation. This number is closer to 10%-30% for general liability, while standard workers' comp litigated claims end up in the ~5% range. The key takeaway here is that workers' comp is not zero.
Firstly, claims data confirms that for 2023, the first-year claims count declined by a low single-digit percentage for workers' comp. For 2020, which was impacted by Covid, the claims count had fallen by 16%. On the other hand, the med-mal (occurrence) claims count jumped by +20% for 2023 while declining by 17% for 2020. The takeaway is that social inflation results in inconsistent trends, and caution is warranted before declaring victory.
Secondly, since looking at claims data gives us an insight into the frequency only, we also looked at a proxy for severity, obtained by dividing total paid losses by the number of claims closed with payments. Shifts in these trends could signal changes in underlying factors which contribute to inflation or even the qualitative nature of claims. Our data again shows material inconsistency across segments, which leads us to believe that caution is warranted compared to expecting an optimistic outcome.
Thirdly, workers' comp and other long-tail loss ratios have diverged meaningfully over the years. We looked at long-term trends, and the workers' comp loss ratio has improved vs. other long-tail lines since 2018. This is eerily reminiscent of the past medmal cycle, which benefited from material reserve redundancies for years before the industry lost the plot on keeping pace with loss-cost trends. Yes, the lines are different, but past trends might serve as a warning for the future.
We discuss these in detail below.
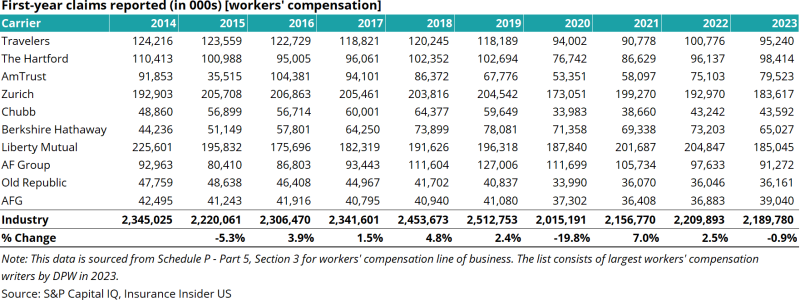
Firstly, workers’ compensation claims count is at a near-decadal low (ex-Covid)
The chart below shows first-year claims reporting for workers' comp over the last decade. In 2023, first-year claims reported fell 1% for the industry and fell 4% for the top 10 players.
The chart below shows the claims count for medmal-occurrence over time for the top 10 players and the industry. For 2023, claims were up 20% for the industry and up 25% for the top 10 players.
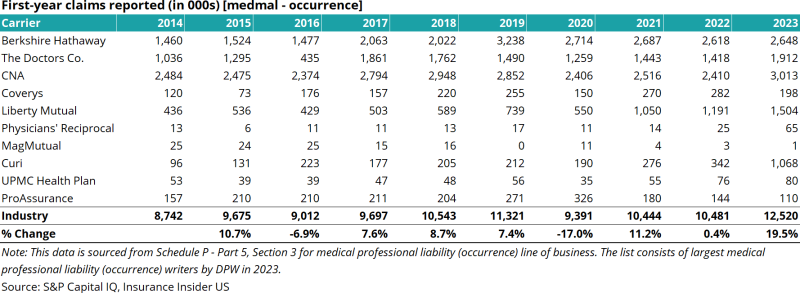
Taking a step back, this exercise shows that volatility in frequency trends exists, and it would be premature to view a decline as a predictor of future trends. Over a few years, loss cost trends could be materially different, and recent trends could give us a false assurance that everything is going well.
Secondly, severity continued to show mixed trends, warranting reserving caution
The analysis above showed frequency trends using claims counts as a proxy. The other side of loss trends - claims inflation severity - can be computed by taking the paid loss number and dividing it by the claim closed with payment. A shift in these trends can give us an insight into trends such as medical cost inflation, wage replacement costs, shifts in the quality of claims, and event claims management.
The table below shows industry claim inflation trends for some of the biggest lines. Note the material volatility in recent trends, which can lead to reserving challenges. For example, medmal claims severity declined for several years before completely flipping and increasing by double-digits.
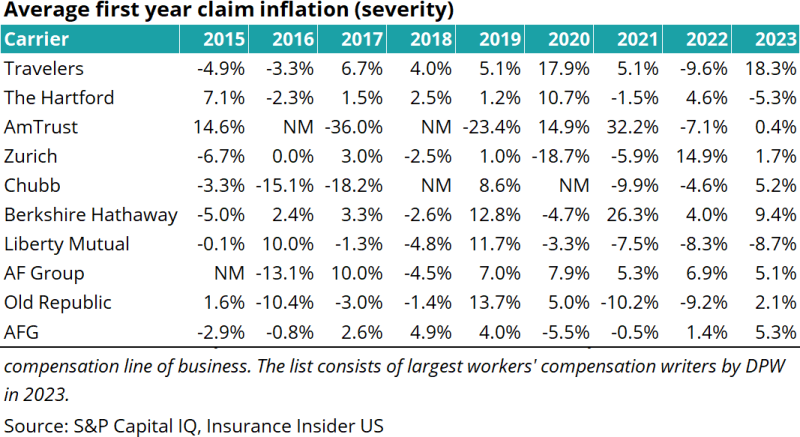
Taking a step back, this ties back to our thesis that recent years’ trends have exhibited unusual volatility, and caution should be exercised when using these as a proxy for future cost trends.
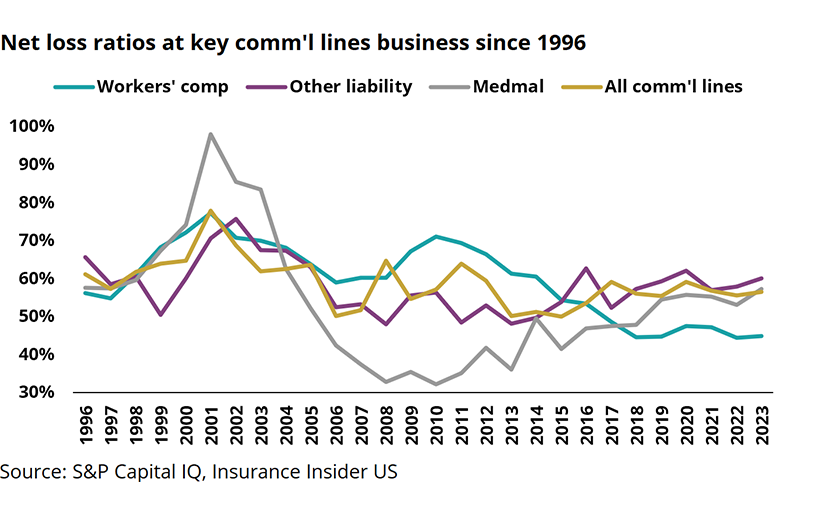
Thirdly, workers' comp is now a major outlier when looking at industry loss ratios
The chart below shows loss ratio trends from 1996, which show several mini-cycles in various segments. One that stands out is medmal, which witnessed material tort reform in the early 2000s after facing years of runaway jury awards. This led to a lengthy period where loss cost trends remained low for the industry, and it benefited from material reserve releases.
However, in recent years, these benefits have not only been completely realized, but trends have also reversed and have continued to worsen partially due to the impact of attorney involvement and larger jury awards.
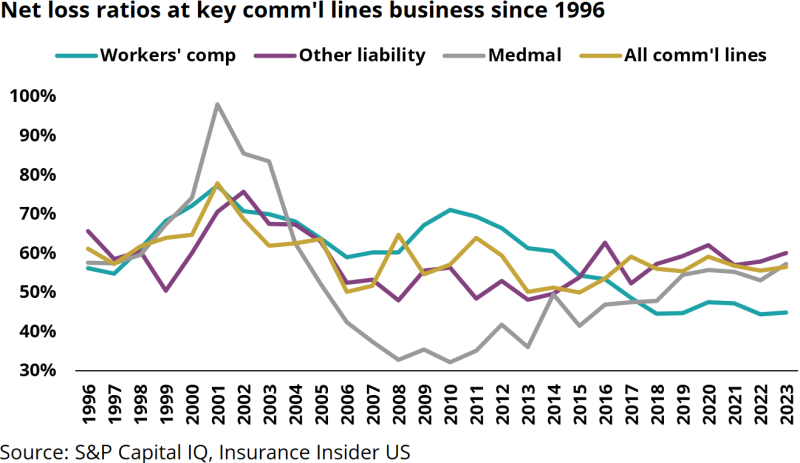
Attorney involvement and its impact have shown up in many lines where it used to be historically limited. Take personal lines, where the industry was caught off-guard before being forced into years of corrective actions. Yes, workers’ comp attorney involvement is lower than other long-tail casualty classes, but caution is warranted if it starts ticking up here too.
The chart below looks at the same loss ratios but indexes them to 2013. This visualization makes it even more apparent that workers' comp has defied all odds, and the gap over time has widened on a relative basis.
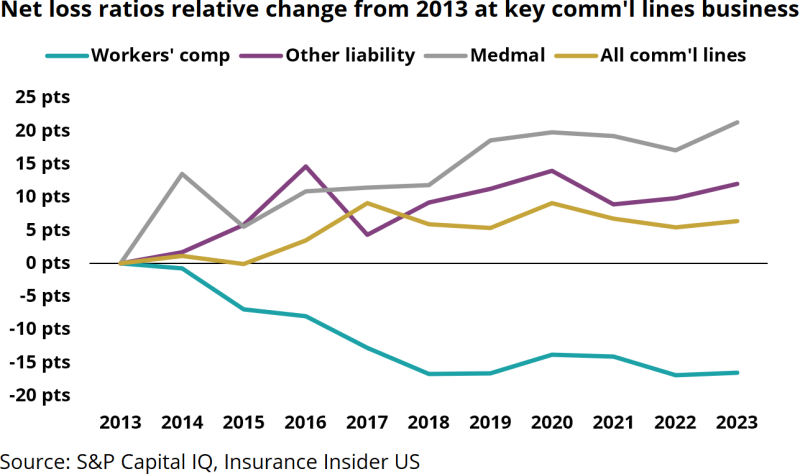
It could be more than likely that we are rounding the bend on the workers’ comp insurance cycle and are already at trough levels, and loss ratios will start narrowing for workers' comp vs. the group.
To bolster our case, we would highlight our prior workers' comp reserve analysis, which showed that recent years have contributed to reserve releases. What that translates into is a low margin of safety if trends start to worsen. In other words, those reserves have already been released, and you can't uncork that bottle of champagne.
In summary, attorney involvement and its impact on claims count are playing out differently across sectors. A faster-than-anticipated turn in the workers’ comp loss cost climate from increasing attorney involvement could lead to a review of recent accident years reserves.
Appendix